Download
1 / 50
500 likes | 610 Views
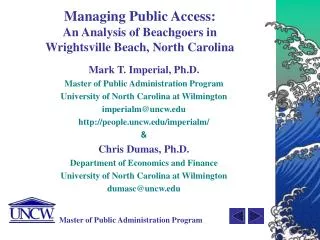
Managing Public Access: An Analysis of Beachgoers in Wrightsville Beach, North Carolina. Mark T. Imperial, Ph.D. Master of Public Administration Program University of North Carolina at Wilmington imperialm@uncw.edu http://people.uncw.edu/imperialm/ & Chris Dumas, Ph.D.

E N D
Managing Public Access:An Analysis of Beachgoers in Wrightsville Beach, North Carolina Mark T. Imperial, Ph.D. Master of Public Administration Program University of North Carolina at Wilmington imperialm@uncw.edu http://people.uncw.edu/imperialm/ & Chris Dumas, Ph.D. Department of Economics and Finance University of North Carolina at Wilmington dumasc@uncw.edu
Objectives of the Study • Determine who the beachgoers are and where they come from • Help argue for greater return of property tax revenue and services from New Hanover County • Help argue for additional funds from the Tourism Development Authority (TDA) • Obtain information that can be used for planning and management purposes • Information incorporated into CAMA Land Use Plan • Help determine how to allocate services • Feedback on services and policy questions (e.g., cost of parking) • Two samples • Typical summer weekday and weekend day
Wrightsville Beach, NC • Population • Year round: 2,604 (declined 11.3% since 1990) • Seasonal: approximately 11,000 on a typical summer weekend • Additional visitors: approximately 8,000 • Build out community, trend is towards redevelopment • Basic Demographics • Education: 60% college or greater (31% in the County) • Median Age: 37.1 (2nd lowest) • Racial Composition: 98.1% white
Wrightsville Beach, NC • Income • Per Capita Income: $36,575 (4th highest among NC beaches) • Median Household Income: $55,903 (6th) • Median Family Income: $71,641 (1st) • Housing • Median Value of Owner Occupied Housing: $480,600 (3rd) • Rent: 80.8% is above $750/month (only 42.4% in County) • Multi-family units: 58% of housing units • 41.8% of Housing Units Occupied Year Round: 41.8% (7th) • Trend towards greater seasonal housing
Public Access Facilities • Beach accesses: 44 (8% of sites) • Length: 4 miles • Public access points/mile: 10.9 (2nd in NC) • CAMA signs: 43 (10.5%) • Parking lot spaces: 605 (8.8%) • Parking spaces/mile: 150.1 (most in NC) • Accesses w/uncounted parking: 38 (874 spaces) • Uncounted parking spaces/mile: 218.5 • Dune walkways: 8 (2%) • Overlook decks/gazebos: 6 (6.8%)
Beach Access Facilities • Handicap Accesses • To dune crest: 9 (7.6% of all NC) • To deck/gazebo: 6 (9/8%) • To beach: 6 (8.6%) • Handicap parking spaces: 20 (8.7%) • Restroom facilities: 3 (6.7%) • Showers: 3 (5.4%) • Picnic tables: 0 (only 13 statewide) • Vehicle access: 6 (6.7%) • Bike racks: 3 (2.5%) • Lifeguards: 10 stands, down from 12
Methodological Challenges • Approximately 4 miles of beach • Beachgoers are not normally distributed • Public access sites • Parking availability • Multi-unit, high density structures & hotels • Need to randomly sample groups of beachgoers • Need to randomly sample adult in a group of beachgoers • Recruiting, training, and managing 20 to 30 surveyors working for 8 hours in 90 degree heat
Distribution of Beachgoers • Rented a pilot and small plane • Flew the length of the beach at 500 ft. • Digital video and still photos for the length of the beach • Counts • Used the photos to break beach into 118 segments using visible landmarks • Team of 2 used videos to count all people, walking, sitting, swimming, etc. and averaged their counts • Data aggregated into 10 grids, then 8
Knowing DistributionProvides Useful Information • It is unlikely that there are more than about 8,000 people on the beach at any one time • Much less than previously thought • Only 1,479 parking spaces • Knowing distribution of beachgoers could improve service delivery: • Linear programming models can be used to optimize the allocation of services like placement of lifeguard stands and trash barrels • Information used to site new facilities (e.g., restrooms)
Survey Instrument • Questionnaire with open- and closed-ended question to find out such things as • Where people came from • How they traveled to the beach • Duration of stay • Factors affection choice of specific beach location • Demographic information • Three versions with different section of questions on • Spending behavior • Contingent behavior on response to increased parking costs • Perceptions of service delivery to residents and visitors • Questionnaires administered by surveyors
Surveyors & Training • Surveyors allocated to 8 grids using a computer algorithm • Ranged from 1 to 10 • Computer model also produced a skip pattern • Made sure experienced surveyor in each grid to help supervise • Training on • Reading questionnaire and collect data • Randomly sampling groups and adults within groups • Reading the informed consent and not interview people under 18 • Using GPS meters • Research team kept in touch via cell phone and collected morning surveys at lunch
Sampling Strategy • Randomly sampling groups • Start at beginning of grid and identify 1st group of beachgoers • Count off systematically until reaching skip number • Random number card used to pick first group and then counted off groups using skip number • Moved systematically in different ways depending o density of groups • Randomly sampling adult • Picked an adult and counted off systematically giving each a number • Used the next random number from the card to select the adult • Asked to participate and read the informed consent • Procedures used to ensure that everyone had an equal probability of getting sampled
Data Entry • At conclusion of AM/PM sessions data was checked to ensure it had appropriate identifying information • Questionnaire coded using software identical to that used for telephone surveys to construct the computer database • Multiple reference points used to identify incorrectly entered data using cross tabulations • Data was checked a final time for potential errors and variables to assist in the analysis were created
Demographics of Beachgoers • Sex • Male: 37.4% • Female: 62.2% • Race • White: 95.2% • Education • High school: 9.5% • Some college: 24.9% • College or greater: 64.9% • Income • 16.6% < $35,000 • 28.6% > $100,000
Where do People Come From? • North Carolina: 75.4% • Mostly New Hanover County, few from Brunswick and Pender Counties • Raleigh metro area is biggest source of NC visitors • Out of State: 24.5% • Virginia, Pennsylvania, Georgia, Maryland, New Jersey, New York, Ohio, Illinois, Texas, etc. • Out of state visitors come from all over • How did they discover Wrightsville Beach? • Grew up here/local resident: 22.9% • Family, friends, word of mouth: 57.4%
Group Characteristics • Group size: • Mean: 4.33 • Range: 1 to 31 • Years coming to Wrightsville Beach • Mean: 12.16 • Median: 8 • Range: 0 to 65 • When do you typically frequent the beach? • During the week: 16.2% • Weekends: 31.8% • Vacation: 32.1%
Current Trip Characteristics • Number of expected trips in 2003 • Mean: 13.03 trips • Median: 3 trips • Length of trip • Mean: 4.11days • Median: 3 days • Range: 1 to 90 days • Total hours on beach • Mean: 4.59 hrs • Median: 4 hrs • How did they travel to beach? • Drive/Passenger in car: 69% • Walk: 29.6%
Other Parking Questions • How long to find a space? • Mean: 4.07 minutes. • Median: 1 minute • Range: 0 to 90 minutes. • Did they park in the area they wanted? • Yes: 91.7% • In the last year, did you try to visit but went elsewhere because there was no parking? • Yes: 31.1% • Number of blocks to walk to the beach • Mean: .9 • Range: 0 to 9
Factors Used to Select Specific Location on Beach • Have they been to same location before? • Yes: 79.9% • Most important factors in choosing location? • Near where you parked: 27.6% • Near condo: 20.3% • Near few people: 7.9% • Near good swimming: 3.9% • Near people know/meet: 3.7% • Near good surfing: 3.6% • Near restrooms: 3% • Near lifeguards: 2.4% • Near a lot of people: 1.4%
Spending Behavior • Looked at the total spent individually: • Wrightsville Beach • Locally but off Wrightsville Beach • Outside the local area • Spending by categories such as: • Parking • Gasoline • Restaurants • Groceries • Beach gear • Entertainment • Hotel/Model/Condo • Rental car/air travel
Directions for Future Research • Analyze the economic data collected • Travel cost models • Economic impact models • Contingent valuation models • Random utility models • Analyze management data • Parking prices • Provision of services • Perceptions of services • Better management of beach traffic • Follow-up survey planned Summer ‘05