Download
1 / 10
100 likes | 173 Views
Electronics’ 2010 18-2 0 May , 2010, Kaunas , Lithuania Nonlinear Chirp Pulse Excitation for the Fast Impedance Spectroscopy. Jaan Ojarand , Paul Annus , Raul Land , Toomas Parve and Mart Min

E N D
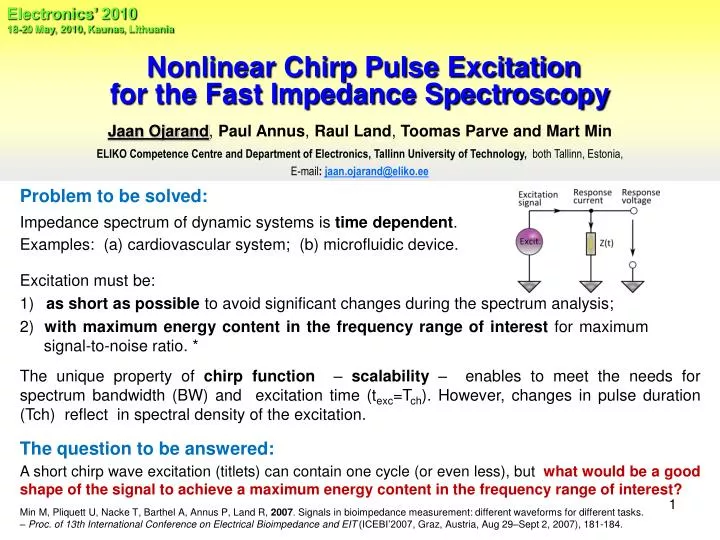
Electronics’ 2010 18-20 May, 2010, Kaunas, Lithuania Nonlinear Chirp Pulse Excitation for the Fast Impedance Spectroscopy • Jaan Ojarand, Paul Annus, Raul Land, Toomas Parveand Mart Min • ELIKO Competence Centre and Department of Electronics, Tallinn University of Technology,both Tallinn, Estonia, • E-mail: jaan.ojarand@eliko.ee Problem to be solved: Impedance spectrum of dynamic systems is time dependent. Examples: (a) cardiovascular system; (b) microfluidic device. Excitation must be: 1)as short as possible to avoid significant changes during the spectrum analysis; 2)with maximum energy content in the frequency range of interest for maximumsignal-to-noise ratio. * The unique property of chirp function – scalability– enables to meet the needs forspectrum bandwidth (BW) and excitation time (texc=Tch). However, changes in pulse duration (Tch) reflectin spectral density of the excitation. The question to be answered: A short chirp wave excitation (titlets) can contain one cycle (or even less), but what would be a good shape of the signal to achieve a maximum energy content in the frequency range of interest? Min M, Pliquett U, Nacke T, Barthel A, Annus P, Land R, 2007. Signals in bioimpedance measurement: different waveforms for different tasks.– Proc. of 13th International Conference on Electrical Bioimpedance and EIT (ICEBI’2007,Graz, Austria, Aug 29–Sept 2, 2007), 181-184.
Electronics’ 2010, May18-20, 2010, Kaunas, Lithuania • Nonlinear Chirp Pulse Excitation for the Fast Impedance Spectroscopy • Jaan Ojarand, Paul Annus, Raul Land, Toomas Parveand Mart Min RMS spectral density (normalized) 10 1 10-1 10-2 10-3 10-4 -40 dB/dec 1mV / Hz1/2 1k 10k 100k 1M f, Hz Single-cycle linearly modulated titlet (short chirp pulse) Bexc ≈ ffin = 100kHz θfin|t=Tch= 2π Current phase , rad, Instant frequency , rad/s Acceleration dω(t)/dt= 2πffin/Tch= 2π(0.5∙1010),rad/s2
Electronics’ 2010, May18-20, 2010, Kaunas, Lithuania • Nonlinear Chirp Pulse Excitation for the Fast Impedance Spectroscopy • Jaan Ojarand, Paul Annus, Raul Land, Toomas Parveand Mart Min Single-cycle nonlinearly modulated titlet For the exponential titlet: to improve the flatness of spectral density curve Instant frequency changes nonlinearly during the excitation interval. In the field of impedance spectroscopy an equal spectral density at all frequencies of interest is desirable though smooth PSD curve above level of 0.5 is often also satisfactory. Titlet waveforms It is possible to shape the spectral density curve by controlling the speed of the frequency change of the chirp. PSD of the signal in the particular frequency range is inversely proportional to the chirp ratein that particular frequency. The advantage of using an exponential relationship is in ease of realization Modulating waveforms Exp.2 and Exp.3 are a sums of upward-sloping and downward-sloping exponential signals
Electronics’ 2010, May18-20, 2010, Kaunas, Lithuania • Nonlinear Chirp Pulse Excitation for the Fast Impedance Spectroscopy • Jaan Ojarand, Paul Annus, Raul Land, Toomas Parveand Mart Min Exponentially modulated titlets Vp is a peak amplitude of the signal, and Kf is the frequency sensitivity of the VCO in Hz/V. Vp is kept constant at the 1V level. Exponentially modulated waveform source More flat in a usable bandwith! Vo express an initial voltage, k is growth constant and τ is the e-folding time. -60 dB/dec -40 dB/dec In the simplest case only one exponentially changing voltage Vexp drives a VCO. However, it was found, that by combining two or more exponential signals with different growth factors it is possible to generate chirp waveforms with substantially steeper slope of spectral curve above the cut-off frequency. Normalized RMS spectral density
Electronics’ 2010, May18-20, 2010, Kaunas, Lithuania • Nonlinear Chirp Pulse Excitation for the Fast Impedance Spectroscopy • Jaan Ojarand, Paul Annus, Raul Land, Toomas Parveand Mart Min PSD curves of linear and exponential titlets Peak amplitudes of all waveforms are same, +/- 1V. Duration of signals is in the region of 40-50 μs, and was varied intentionally to get the same cut-off frequency (36 kHz) where PSD falls to the level of 0.5 (-6dB) Modulating waveforms Normalized PSD, logarithmic scale Steeperslopes Small difference in shapes The slope of distribution curve above the cut-off frequency characterizes the ratio of the energies laying in the desired frequency range and above of it. However, most likely it is more adequate to compare distribution of the energy of different waveforms in the frequency range of interest. As we can see, in this case difference between signals Exp.1 and Exp.3 is not significant. Normalized PSD linear scale
Electronics’ 2010, May18-20, 2010, Kaunas, Lithuania • Nonlinear Chirp Pulse Excitation for the Fast Impedance Spectroscopy • Jaan Ojarand, Paul Annus, Raul Land, Toomas Parveand Mart Min PSD curves and energy content PSD curves, where the spectra are normalized separately for each signal are not suitable for the comparison of the energy content of different signals since the maximum values are not equal. To compare the spectral content of different signals, they must be normalized against one of them. PSD, normalized against the max. value of linear titlet, linear scale According to Parseval’s theorem, the total energy in the frequency domain must be the same as in time time domain. Due to the higher frequency components, a certain part of the signal energy falls outside of the useful bandwidth. Summing up of the PSD values using a small predetermined frequency interval Δf over the full frequency range and dividing the sum of the useful frequency range with total sum, we can find the ratio of useful energy content to the total energy content of the excitation signal. Computer simulation using Δf = 10Hz and bandwith 320 kHz was done. Results are presented in the column of EBW/E of the table on the next slide.
Electronics’ 2010, May18-20, 2010, Kaunas, Lithuania • Nonlinear Chirp Pulse Excitation for the Fast Impedance Spectroscopy • Jaan Ojarand, Paul Annus, Raul Land, Toomas Parveand Mart Min Energy and power of titlets 1. Energy of the generated signal , V2∙s 2.Average power of the generated signal ,,V Thermal noise: 4nV/Hz 1/2 EBW- energy content in frequency range of interest (36 kHz), where the energy level is above 0.5 (-6dB) EBWmax – maximum possible energy content in frequency range of interest (rectangular PSD curve) E- energy content in full bandwith observed (320 kHz).
Electronics’ 2010, May18-20, 2010, Kaunas, Lithuania • Nonlinear Chirp Pulse Excitation for the Fast Impedance Spectroscopy • Jaan Ojarand, Paul Annus, Raul Land, Toomas Parveand Mart Min Practical measurements Titlet1 waveform Vch(t), V Normalized PSD for ½ of excitation, linear scale • Practical measurements were carried out in the Institute for Bioprocessing and Analytical Measurement Techniques (Heilbad Heiligenstadt, Germany). • Excitation signal was generated by Tektronix AGF3252 ARB signal generator, current and voltage were measured using Tektronix DPO70804 digital oscilloscope. • Spectra of the module and phase of the impedance were calculated in the LabView environment.
Electronics’ 2010, May18-20, 2010, Kaunas, Lithuania • Nonlinear Chirp Pulse Excitation for the Fast Impedance Spectroscopy • Jaan Ojarand, Paul Annus, Raul Land, Toomas Parveand Mart Min Conclusions -Nonlinear modulation of the VCO allows to shape the PSD curveof the chirp excitation waveforms. -Usage of the exponential modulation signals improves the flatness of spectral density curve of one cycle chirp‘sand increases the energy content in the usable frequency range by more than 20 %, compared to its linear counterpart. -Short chirp excitation (titlet) is a perspective candidate for implementation in wideband spectroscopy of dynamic impedances.
Electronics’ 2010, May18-20, 2010, Kaunas, Lithuania • Nonlinear Chirp Pulse Excitation for the Fast Impedance Spectroscopy • Jaan Ojarand, Paul Annus, Raul Land, Toomas Parveand Mart Min • References 1. Nahvi, M., Hoyle, B.S. Electrical Impedance Spectroscopy Sensing for Industrial Processes// IEEE Sensors Journal. – 2009. – No. 12 (9). – P. 1808-1816. • . Min M., Giannitsis A. T., Land R., Cahill B. P., Pliquett U., Nacke T., Frense D., Gastrock G., Beckmann D. Comparison of rectangular wave excitations in broad band impedance spectroscopy for microfluidic applications //IFMBE Proceedings, Vol.25: VII World Congress on Medical Physics and Biomedical Engineering. – Munich (Germany), 2009. – P.85-88. • . Min M., Pliquett U., Nacke T., Barthel A., Annus P., Land R.. Signals in bioimpedance measurement: different waveforms for different tasks // IFMBE Proceedings, Vol. 17: 13th Int. Conf. on Electrical Bioimpedance (ICEBI’2007). – Graz (Austria), 2007. – P. 181-184. • . Min, M., Land, R., Annus, P., Ojarand, J. Chirp Pulse Excitation in the Impedance Spectroscopy of Dynamic Subjects: signal modelling in time and frequency domain // Transactions on Systems, Signals and Devices. – Aachen: SHAKER Verlag (Germany), 2010. – in print (2p.). • . Min M., Land R., Paavle T., Parve T., Annus P. Broadband spectroscopy of a dynamic impedance// Journal of Physics: Proceedings ICEBI2010. – London: IOP, 2010. – in print (4p). • . Annus, P., Min, M., Ojarand, J. Shortened square wave waveforms in synchronous signal processing// Proceedings I2MTC2008. – Victoria, British Columbia (Canada), 2008. – P. 1259 - 1262. • .Skolnik M.I. Radar Handbook (3rd edition). – McGraw-Hill, 2008. – 1352 p. • . Darowicki K., Slepski P. Determination of electrode impedance by means of exponential chirp signal // Electrochemistry Communications. – 2004. – No. 6. – P.898–902. • . Doerry A.W. Generating Nonlinear FM Chirp Waveforms for Radar (Research Report). – Sandia National Laboratories (New Mexico, USA), 2006. – 34 p. Acknowledgments The research was supported by the European Union (EU) through the European Regional Development Fund, Enterprise Estonia through the ELIKO Competence Center. Thank you for your attention !