Parallel Geospatial Data Management for Multi-Scale Environmental Data Analysis on GPUs
10 likes | 186 Views
Cells. Polygon vertices. (C) Outside. (B) Inside. V. T. Temporal Trends. ROIs. High-End Computing Facility. C. B. A. Thread Block. Parallel Geospatial Data Management for Multi-Scale Environmental Data Analysis on GPUs.

Parallel Geospatial Data Management for Multi-Scale Environmental Data Analysis on GPUs
E N D
Presentation Transcript
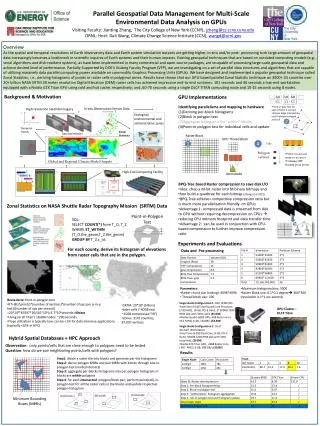
Cells Polygon vertices (C) Outside (B) Inside V T Temporal Trends ROIs High-End Computing Facility C B A Thread Block Parallel Geospatial Data Management for Multi-Scale Environmental Data Analysis on GPUs Visiting Faculty: Jianting Zhang, The City College of New York (CCNY), jzhang@cs.ccny.cuny.edu ORNL: Host: Dali Wang, Climate Change Science Institute (CCSI), wangd@ornl.gov Overview 2 3 As the spatial and temporal resolutions of Earth observatory data and Earth system simulation outputs are getting higher, in-situ and/or post- processing such large amount of geospatial data increasingly becomes a bottleneck in scientific inquires of Earth systems and their human impacts. Existing geospatial techniques that are based on outdated computing models (e.g., serial algorithms and disk-resident systems), as have been implemented in many commercial and open source packages, are incapable of processing large-scale geospatial data and achieve desired level of performance. Partially Supported by DOE’s Visiting Faculty Program (VFP), we are investigating on a set of parallel data structures and algorithms that are capable of utilizing massively data parallel computing power available on commodity Graphics Processing Units (GPUs). We have designed and implemented a popular geospatial technique called Zonal Statistics, i.e., deriving histograms of points or raster cells in polygonal zones. Results have shown that our GPU-based parallel Zonal Statistic technique on 3000+ US counties over 20+ billion NASA SRTM 30 meter resolution Digital Elevation (DEM) raster cells has achieved impressive end-to-end runtimes: 101 seconds and 46 seconds a low-end workstation equipped with a Nvidia GTX Titan GPU using cold and hot cache, respectively; and ,60-70 seconds using a single OLCF TITAN computing node and 10-15 seconds using 8 nodes. GPU Implementations Background & Motivation … … M1 M1 M2 … … C1 C2 C3 Identifying parallelisms and mapping to hardware Deriving per-block histograms Block in polygon test Aggregate histograms for “within” blocks Point-in-polygon test for individual cells and update • Point-in-poly test for each of cell’s 4 corners • All-pair Edge intersection tests between polygon and cell In-situ Observation Sensor Data High-resolution Satellite Imagery T T T Ecological, environmental and administrative zones 2 Zonal Statistics Data Assimilation Raster Block GPU Thread Block 4 1 • Perfect coalesced memory accesses • Utilizing GPU floating point power T Global and Regional Climate Model Outputs AtomicAdd (A) Intersect • BPQ-Tree based Raster compression to save disk I/O • Idea: chop a M-bit raster into M binary bitmaps and then build a quadtree for each bitmap (Zhang et al 2011) • BPQ-Tree achieves competitive compression ratio but is much more parallelization friendly on GPUs • Advantage 1: compressed data is streamed from disk to GPU without requiring decompression on CPUs reducing CPU memory footprint and data transfer time • Advantage 2: can be used in conjunction with CPU-based compression to further improve compression ratio Zonal Statistics on NASA Shuttle Radar Topography Mission (SRTM) Data Point-in-Polygon Test SQL: SELECT COUNT(*) from T_O, T_Z WHERE ST_WITHIN (T_O.the_geom,T_Z.the_geom) GROUP BYT_Z.z_id; Experiments and Evaluations For each county, derive its histogram of elevations from raster cells that are in the polygon. Data and Pre-processing • Parameters: • Raster chunk size (coding): 4096*4096 • Thread block size: 256 • Maximum histogram bins: 5000 • Raster Block size: 0.1*0.1 degree 360*360 (resolution is 1*1 arc-second) • Brute-force Point-in-polygon test • RT=(#of points)*(number of vertices)*(number of ops per p-in-p test)/(number of ops per second) =20*109*87097*20/(10*109)=3.7*106seconds=40days • Using up all Titan’s 18,688 nodes: ~200 seconds • Flops utilization is typically low: can be <1% for data intensive applications (typically <10% in HPC) • Single Node Configuration 1: Dell T5400 WS • Intel Xeon E5405 dual Quad-Core Processor (2.00 GHZ), 16 GB, PCI-E Gen2, 3*500GB 7200 RPM disk with 32M cache ($5,000) • Nvidia Quadro 6000 GPU, 448 Fermi core ( 574 MHZ), 6 GB, 144GB/s ($4,500) • SRTM: 20*109 (billion) raster cells (~40GB raw, ~15GB compressed TIFF) • Zones: 3141 counties, 87,097 vertices GPU Cluster : OLCF Titan • Single Node Configuration 2: Do-IT Yourself Workstation • Intel Core-i5 650 Dual-Core, 8 GB, PCI-E Gen3, 500GB 7200 RPM disk with 32M (recycled), ($1000) • Nvidia GTX Titan GPU, 2688 Kepler core ( 837 MHZ), 6 GB, 288 GB/s ($1000) Hybrid Spatial Databases + HPC Approach Observation : only points/cells that are close enough to polygons need to be tested Question: how do we pair neighboring points/cells with polygons? Results Step1: divide a raster tile into blocks and generate per-tile histograms Step 2: derive polygon MBRs and pair MBRs with blocks through box-in-polygon test (inside/intersect) Step 3: aggregate per-blocks histograms into per-polygon histograms if blocks are within polygons Step 4: for each intersected polygon/block pair, perform point(cell)-in-polygon test for all the raster cells in the blocks and update respective polygon histogram Minimum Bounding Boxes (MBRs)