Download
1 / 16
160 likes | 287 Views
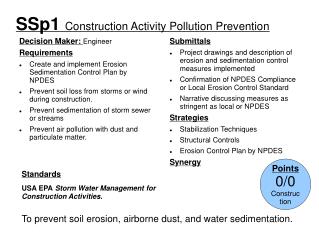
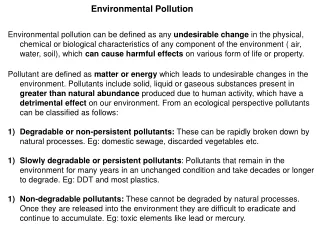
Pollution Prevention Metrics Promoting Activity Accountability and Managing Environmental Improvements at CNRSW. National Defense Industrial Association (NDIA) 30 th Environmental and Energy Symposium & Exhibition April 7, 2004 Delphine Lee, BMT Designers & Planners

E N D
Pollution Prevention MetricsPromoting Activity Accountability and Managing Environmental Improvements at CNRSW National Defense Industrial Association (NDIA) 30th Environmental and Energy Symposium & Exhibition April 7, 2004 Delphine Lee, BMT Designers & Planners Ed Bonnes, CNRSW Environmental
Naval Base Point Loma, San Diego, CA Naval Weapons Station Seal Beach SD Det. Puget Sound Naval Shipyard SD Det. Hazardous Waste Generation (Shore Activities) in 2001 ~ 327,000 lbs
Traditional P2 Review, Example #1 Puget Sound Naval Shipyard, San Diego Detachment Processes Possible PPEP Equipment Hazardous Waste Reduction • Battery Well Cleaning • Pipe / Heat Exchanger Flushing • Radiological Testing • Sand Blasting Blast Booth 0 lbs Total Hazardous Waste Reduction = 0 lbs
Traditional P2 Review, Example #2 Naval Weapons Station Seal Beach San Diego Detachment Processes Possible PPEP Equipment Hazardous Waste Reduction • Torpedo Flushing • Touchup Painting • Parts Cleaning Aqueous Parts Washer 1,800 lbs Total Hazardous Waste Reduction = 1,800 lbs
Pollution Prevention Metrics Activity Waste Description Quantity of Waste Disposed EPA and State Waste Codes Unit Cost for Disposal Method of Disposal Waste Pickup Date
Targeting the Largest Hazardous Waste Stream Hazardous Waste Disposal 15,000 gal / sub $32 K / year Acid Water Heat Exchanger Current Process Tank Acid, Heavy Metals and Scale Labor Savings 50 hours 10 peo / crew $80 / person $40 K / sub $80 K / year Acid Proposed Process Recycling System Heat Exchanger Water Water Hazardous Waste Reduction: 160,000 lbs/yr Savings: $100 K / yr
Targeting the Second Largest Waste Stream Current Process Parts Engine Ullage Transducer Oils Sludge HCN gas Metals Water 33% Seawater Otto Fuel 10% Oils with sludge and metals 10% Seawater 6% Drain Underground Storage Tank Water with alcohol, detergent and oils 43% Hazardous Waste Disposal 6000 gal $30 K / year
Targeting the Second Largest Waste Stream (Con’t) Proposed Process Parts Engine Ullage Transducer Oils Sludge HCN gas Metals Water 33% Seawater Otto Fuel 10% Water with sludge and metals 10% Seawater 6% Drain Underground Storage Tank NUWC Keyport Sewer BOWTS Water with alcohol, detergent and oils 43% Savings: $20 K / yr Hazardous Waste Reduction: 33,000 lbs BOWTS
Results of P2 Efforts 70% Hazardous Waste Reduction
Making Activities Accountable Activity Waste Description Quantity of Waste Disposed EPA and State Waste Codes Unit Cost for Disposal Method of Disposal Waste Pickup Date
Tracking Pollution Prevention Efforts Activity Waste Description Quantity of Waste Disposed EPA and State Waste Codes Unit Cost for Disposal Method of Disposal Waste Pickup Date
Summary • P2 data were organized in 2 main ways at NBPL: • By Waste Stream • By Activity • Developing P2 metrics helped NBPL: • Focus its efforts on its top 10 waste streams • Make activities accountable for implementing P2 recommendations • Track progress towards P2