Download
1 / 36
370 likes | 636 Views
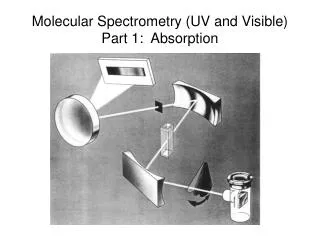
Chapter 3 Molecular Absorption Spectrometry.

E N D
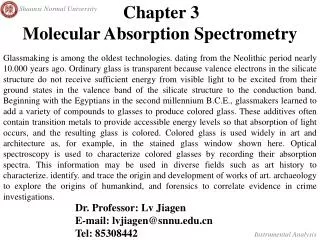
Chapter 3 Molecular Absorption Spectrometry Glassmaking is among the oldest technologies. dating from the Neolithic period nearly 10.000 years ago. Ordinary glass is transparent because valence electrons in the silicate structure do not receive sufficient energy from visible light to be excited from their ground states in the valence band of the silicate structure to the conduction band. Beginning with the Egyptians in the second millennium B.C.E., glassmakers learned to add a variety of compounds to glasses to produce colored glass. These additives often contain transition metals to provide accessible energy levels so that absorption of light occurs, and the resulting glass is colored. Colored glass is used widely in art and architecture as, for example, in the stained glass window shown here. Optical spectroscopy is used to characterize colored glasses by recording their absorption spectra. This information may be used in diverse fields such as art history to characterize. identify. and trace the origin and development of works of art. archaeology to explore the origins of humankind, and forensics to correlate evidence in crime investigations. Dr. Professor: Lv Jiagen E-mail: lvjiagen@snnu.edu.cn Tel: 85308442
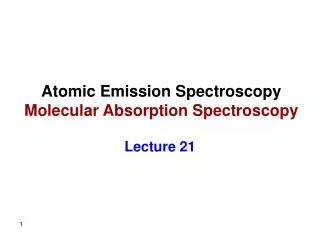
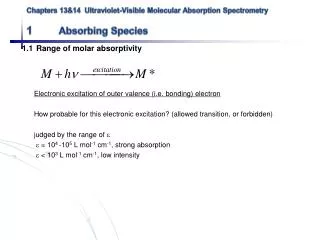
3A ULTRAVIOLET AND VISIBLE MOLECULAR ABSORPTION SPECTROSCOPY In this section, we first consider types of molecular species that absorb ultraviolet and visible radiation. We then describe qualitative and quantitative applications of spectroscopy in the UV-visible region of the spectrum. The section concludes with a discussion of spectrophotometric titrations and studies of the composition of Complexions. 3A-l Absorbing Species
Absorption by Organic Compounds Absorption spectra for typical organic compounds.
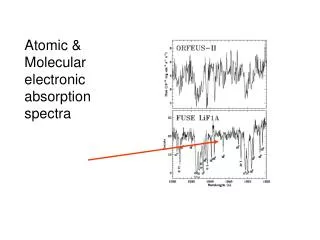
Absorption by Inorganic Species Absorption spectra of aqueous solutions of transition metal ions. Absorption spectra of aqueous solutions of rare earth ions.
charge-transferabsorption Absorption spectra of aqueous charge-transfer complexes.
3A-2 Qualitative Applications of Ultraviolet/Visible Spectroscopy Solvents The table lists common solvents for studies in the ultraviolet and visible regions and their approximate lower wavelength limits. These limits strongly depend on the purity of the solvent. For example, ethanol and the hydrocarbon solvents are frequently contaminated with benzene, which absorbs below 280 nm.
The Effect of Slit Width The effect of variation in slit width, and hence effective bandwidth, is illustrated by the spectra in the Figure. Clearly, peak heights and separation are distorted at wider bandwidths. Because of this. spectra for qualitative applications should be measured with minimum slit widths. Spectra for reduced cytochrome c obtained with four spectral bandwidths: (1) 20 nm. (2) 10 nm, (3) 5 nm, and (4) 1 nm. At bandwidths < 1 nm, peak noise became pronounced. (Courtesy of Varian, Inc., Palo Alto, CA.)
The Effect of Scattered Radiation at the Wavelength Extremes of a Spectrophotometer Earlier we demonstrated that scattered radiation may lead to instrumental deviations from Beer's law (p.733). Another undesirable effect of this type of radiation is that it occasionally causes false peaks to appear when a spectrophotometer is being operated at its wavelength extremes. The figure shows an example of such behavior. Spectra of cerium (IV) obtained with a spectrophotometer having glass optics (A) and quartz optics (B). The false peak in A occurs when stray radiation is transmitted at long wavelengths.
Wide applicability High sensitivity Moderate to high selectivity Good accuracy Ease and convenience 3A-3 Quantitative Applications Absorption spectroscopy based on ultraviolet and visible radiation is one of the most useful tools available to the chemist for quantitative analysis. The important characteristics of spectrophotometric and photometric methods are
Application to Absorbing Species Applications to Nonabsorbing Species Scope Typical chelating reagents for absorption. (a) Diethyldithiocarbamate. (b) Diphenylthiocarbazone
Wavelength Selection Variables That Influence Absorbance Determination of the Relationship between Absorbance and Concentration Procedural Details The Standard Addition MethodThis technique involves adding several increments of a standard solution to sample aliquots of the same size. Each solution is then diluted to a fixed volume before measuring its absorbance. When the amount of sample is limited. standard additions can be carried out by successive addition of increments of the standard to a single measured aliquot of the unknown. The measurements are made on the original solution and after each addition of standard analyte.
(3-1) where k is a constant equal to .A plot of , as a function of should yield a straight line of the form and where the slope m and the intercept b are given by
(3-2) (3-3) (3-4) which rearranges to
(3-5) (3-6) Analysis of Mixtures The Effect of Instrumental Uncertainties The accuracy and precision of spectrophotometric analyses are often limited by the indeterminate error, or noise, associated with the instrument. A spectrophotometric absorbance measurement entails three steps: a 0% T adjustment, a 100% T adjustment, and a measurement of % T. The random errors associated with each of these steps combine to give a net random error for the final value obtained for T. The relationship between the noise encountered in the measurement of T and the resulting concentration uncertainty can be derived by writing Beer's law in the form
(3-7) (3-8) The best and most useful measure of the random error is the standard deviation . which is easily measured for a given instrument by making 20 or more replicate transmittance measurements of an absorbing solution. where and are relative standard deviations.
Sources • Concentration Errors When readout resolution ; thermal detector noise ; dark Effect of T on Relative Standard Deviation of Concentration (3-9)
EXAMPLE 3-1 A spectrophotometric analysis was performed with a manual instrument that exhibited an absolute standard deviation in transmittance of throughout its transmittance range. Calculate the relative standard deviation in concentration that results from this uncertainty when the analyte solution has an absorbance of (a) l.000 and (b) 2.000. (a) To convert absorbance to transmittance. we write
(b) At A=2.000, T=antilog(-2.000)=0.010 Experimental curves relating relative concentration uncertainties to absorbance for two spectrophotometers. Data obtained with (a) a Spectronic 20, a low-cost instrument ,and (b) a Cary 118, a research-quality instrument.
(3-10) Sources • Concentration Errors When Photon detector shot noise Effect of T on Relative Standard Deviation of Concentration
Concentration Errors When (3-11) Sources Cell positioning uncertainty ; fluctuation in source intensity Effect of T on Relative Standard Deviation of Concentration
Error curves for various categories of instrumental uncertainties.
The Method of Continuous Variations 3A-4 Spectrophotometric Studies of Complex Ions Continuous-variation plot for the 1:2 complex ML2 .
The Mole-Ratio Method Mole-ratio plots for a 1: 1 and a 1:2 complex. The 1:2 complex is the more stable of the two complexes as indicated by closeness of the experimental curve to the extrapolated lines. The closer the curve is to the extrapolated lines, the larger the formation constant of the complex; the larger the deviation from the straight lines, the smaller the formation constant of the complex.
Consider the reaction in which the complex MxLy is formed by the reaction of x moles of the cation M with y moles of a ligand L: • The Slope-Ratio Method If the system obeys Beer’s law,
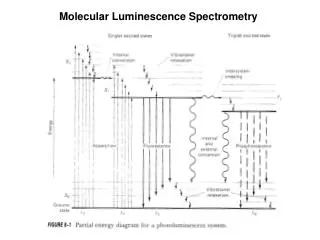
3B INFRARED ABSORPTION SPECTROSCOPY 3B-1 Infrared Absorption Spectra For example, n-butanal (CH3CH2CH2CHO) has 33 vibrational modes. most differing from each other in energy. Not all of these vibrations produce infrared bands, but, as shown in the Figure, the spectrum for n-butanal is relatively complex.
Infrared spectrum for n-butanal (n-butyraldehyde). The vertical scale is plotted as transmittance. as has been common practice in the past. The horizontal scale is linear in wavenumbers. which is proportional to frequency and thus energy. Most modern IR spectrometers are capable of providing data plotted as either transmittance or absorbance on the vertical axis and wavenumber or wave-length on the horizontal axis.
Dispersive Instruments Fourier- Transform Spectrometers (FTIR) Filter Photometers 3B-2 Instruments for Infrared Spectroscopy The FTIR spectrometer is now the most common infrared spectrometer. The great majority of commercial infrared instruments are FTIR systems.
Photo of a basic student-grade benchtop FTIR spectrometer. Spectra are recorded in a few seconds and displayed on the LCD panel for viewing and interpretation. The spectra may be stored in a memory card for later retrieval and analysis, or optionally they may be printed.
3B-3 Qualitative Applications of Infrared Spectrophotometry FEATURE 3-1 Producing Spectra with an FTIR Spectrometer The Figure shows an optical diagram for a Michelson interferometer similar to he one in the spectrometer depicted in the Figure.
Instrument diagram for a basic FTIR spectrometer. Radiation of all frequencies from the IR source is reflected into the interferometer where it is modulated by the moving minor on the left. The modulated radiation is then reflected from the two mirrors on the right through the sample in the compartment at the bottom. After passing through the sample. the radiation falls on the detector. A data acquisition system attached to the detector records the signal and stores it in the memory of a computer as an interferogram.
(a) Interferogram obtained from a typical FTIR spectrometer for methylene chloride. The plot shows detector signal output as a function of time, or displacement of the moving minor of the interferometer. (b) IR spectrum of methylene chloride produced by the Fourier transformation of the data in (a). Note that the Fourier transform takes signal intensity collected as a function of time and produces transmittance as a function of frequency after subtraction of a background interferogram and proper scaling.
Absorbance Measurements Applications of Quantitative Infrared Spectroscopy 3B-4 Quantitative Infrared Photometry and Spectrophotometry The table illustrates the variety of atmospheric pollutants that can be determined with a simple. portable filter photometer equipped with a separate interference filter for each analyte species, Of the more than 400 chemicals for which maximum tolerable limits have been set by OSHA, half or more have absorption characteristics that make them amenable to determination by infrared photometry or spectrophotometry. With so many compounds absorbing, overlapping peaks are quite common. In spite of this potential disadvantage, the method provides a moderately high degree of selectivity.