Download
1 / 50
500 likes | 614 Views
Part 10 Gene Prediction and Regulation. Protein networks - optimized molecular computers. E. coli – a model organism. Single cell, 1 micron length. Contains only ~1000 protein types at any given moment. still :. Amazing technology. computer. sensors. engine. Communication bus.

E N D
E. coli – a model organism Single cell, 1 micron length Contains only ~1000 protein types at any given moment still : Amazing technology computer sensors engine Communication bus
Flagella assembly • Composed of 12 types of proteins • Assembled only when there is an environmental need for motility • Built in an efficient and precise temporal order
Protein RNA DNA DNA – same inside every cell, the instruction manual, 4-letter chemical alphabet – A,G,T,C Proteins are encoded by DNA translation transcription E. Coli – 1000 protein types at any given moment >4000 genes (or possible protein types) – need regulatory mechanism to select the active set
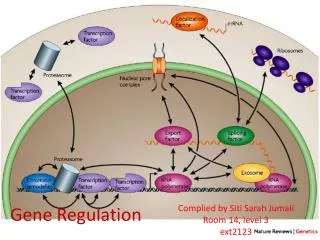
protein protein protein Inducer (external signal) Gene Regulation • Proteins are encoded by the DNA of the organism. • Proteins regulate expression of other proteins by interacting with the DNA DNA Coding region promoter region ACCGTTGCAT
Activators increase gene production X Y Activator X No transcription gene Y X binding site Y Y Y Y Sx X* X INCREASED TRANSCRIPTION X* Bound activator
Repressors decrease gene production X Y Bound repressor Sx X* X No transcription X* Bound repressor Y Y Unbound repressor Y Y X
An environmental sensing mechanism ... Signal 1 Signal 2 Signal 3 Signal 4 Signal N Environment ... X1 X2 X3 Transcription factors Xm genes ... gene k gene 4 gene 5 gene 6 gene 2 gene 3 gene 1
X Y Gene Regulatory Networks • Nodes are proteins (or the genes that encode them)
The gene regulatory network of E. coli Shen-Orr et. al. Nature Genetics 2002 • shallow network, few long cascades. • modular • compact in-degree (promoter size limitation)
protein Asymmetric degree distribution due to Promoter size limitation X DNA promoter region ACCGTTGCAT Coding region
lacZ Example – Energy source utilization 2 possible energy sources The E. coli prefers glucose lacZ is a protein needed to break down lactose into carbon How will the E. coli decide when to create this protein?
Proteins have a cost • E. Coli creates ~106 proteins during its life time • ~1000 copies on average for each protein type E. Coli will grow 1/1000 slower, Enough for evolutionary pressure
Unbinds when senses lactose lactose sensor binds when senses no glucose glucose absence sensor LacZ Production AND gate encoded by proteins and DNA lactose ~glucose lacZ gene is controlled by 2 “sensory” proteins : TTGACA…TATAAT TTGACA…TATAAT TTGACA…TATAAT TTGACA…TATAAT Jacob & Monod, J. Mol. Biol. 1961
E.Coli Glucose Lactose Experimental measurement of input function promoter ….ctgaagccgcttt…. GFP The bacteria becomes green in proportion to the production rate
The input function of the lactose operon is more elaborate than a simple AND gate Lactose (IPTG) lactose (IPTG) glucose (cAMP) glucose (cAMP) Setty et. al. PNAS 2003
E. Coli can modify the input function by small changes in the promoter DNA …AAGGCCT… LacZ gate AND gate …AAGTCCT… OR gate …AAGTCTT…
Negative autoregulation Simple regulation X A Negative autoregulation X A K
Negative autoregulationis a hugely statistically significant pattern N=420 Nodes E=520 Edges Es=40 self-edges Blue nodes have self-edges
A protein with negative autoregulation is a recurring pattern with a defined function Are there larger recurring patterns which play a defined functional role ? XOR logic network Recurring pattern Defined function
Network motifs Subgraphs which occur in the real network significantly more than in a suitable random ensemble of networks.
Basic terminology 3-node subgraph
Basic terminology 4-node subgraph
x x y y z z Two examples of 3-node subgraphs 3-node feedback loop (cycle) Feed-forward loop
199 4-node directed connected subgraphs And it grows pretty fast for larger subgraphs : 9364 5-node subgraphs, 1,530,843 6-node…
5 1 6 13 2 16 Real = 5 Rand=0.5±0.6 Zscore (#Standard Deviations)=7.5
Network motifs Subgraphs which occur in the real network significantly more than in a suitable random ensemble of networks. Algorithm : 1) count all n-node connected subgraphs in the real network. 2) Classify them into one of the possible n-node isomorphic subgraphs 3) generate an ensemble of random networks- networks which preserve the degree sequence of the real network 4) Repeat 1) and 2) on each random network • Subgraphs with a high Z-score are denoted as network motifs.
Only one 3-node network motif – the feedforward loop Nreal=40 Nrand=7±3 Z Score (#SD) =10
Blue nodes= x y z FFL
The coherent FFL circuit Sx X Sy Y AND Z
Coherent FFL – a sign sensitive filter Threshold for activating Y
OFF pulse Feedforward loop is a sign-sensitive filter Vs. =lacZYA =araBAD Mangan et. al. JMB
Sx X Sx Sy Y Kyz Y* Y* Kyz AND Z Z Time Incoherent FFL – a pulser circuit
A motif with 4 nodes :bi-fan Nreal=203 Nrand=47±12 Z Score=13
bifans extend to form Dense-Overlapping-Regulons Array of gates for hard-wired decision making
Single Input Module motifs can control timing of gene expression Shen-Orr et. al. Nature Genetics 2002
The order of gene expression matches the order of the pathway Fluorescence argR argR Glutamate argA N-Ac-Glutamate argB N-Ac-glutamyl-p argE argA argB argC N-Ac-glutamyl-SA argD N-Ac-Ornithine argE Ornithine 0 20 40 60 80 100 (min) Arginine Zaslaver et. al. Nature Genetics 2004
Single Input Module motif is responsible for exact timing in the flagella assembly
Single Input Module motif is responsible for exact timing in the flagella assembly Kalir et. al., science,2001
The gene regulatory network of E. coli Shen-Orr et. al. Nature Genetics 2002
Gene regulation networks can be simplified in terms of recurring building blocks Network motifs are functional building blocks of these information processing networks. Each motif can be studied theoretically and experimentally.
Efficient detection of larger motifs? • The presented motif detection algorithm is exponential in the number of nodes of the motif. • More efficient algorithms are needed to look for larger motifs in higher-order organism that have much larger gene-regulatory networks.
http://www.weizmann.ac.il/mcb/UriAlon/ Papers mfinder – network motif detection software Collection of complex networks More information :