Download
1 / 79
790 likes | 1.04k Views
Chapter 3. Describing Motion . Layout of Chapter . Diagrams. How to read and represent data. Introduction to Diagrams

E N D
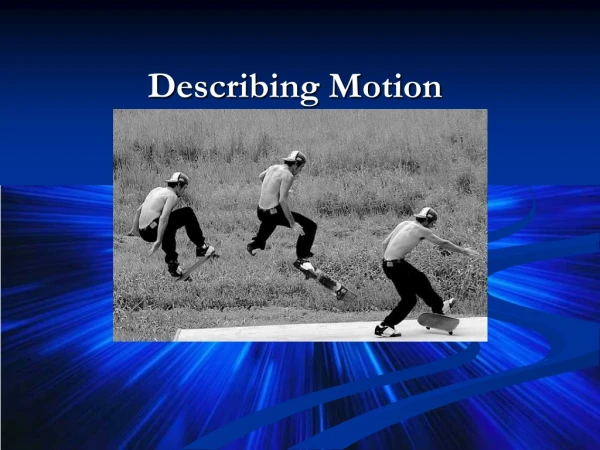
Chapter 3 Describing Motion
Diagrams How to read and represent data
Introduction to Diagrams • Throughout the course, there will be a persistent appeal to your ability to represent physical concepts in a visual manner. You will quickly notice that this effort to provide visual representation of physical concepts permeates class discussions and activities
The worlds • The world which we are studying in this course is the physical world - a world which we can see. And if we can see it, we certainly ought to visualize it. And if we seek to understand it, then that understanding ought to involve visual representations. So as you proceed on your pursuit of physics knowledge, always be mindful of your ability (or lack of ability) to visually represent it.
Visual Representations • The world which we are studying in this course is the physical world - a world which we can see. And if we can see it, we certainly ought to visualize it. And if we seek to understand it, then that understanding ought to involve visual representations. So as you proceed on your pursuit of physics knowledge, always be mindful of your ability (or lack of ability) to visually represent it.
Two types of diagrams • The two most commonly used types of diagrams used to describe the motion of objects are: • ticker tape diagrams • vector diagrams
Ticker Tape Diagrams A history of motion
Ticker Tape • A common way of analyzing the motion of objects in physics labs is to perform a ticker tape analysis. A long tape is attached to a moving object and threaded through a device that places a tick upon the tape at regular intervals of time - say every 0.1 second. As the object moves, it drags the tape through the "ticker," thus leaving a trail of dots. The trail of dots provides a history of the object's motion and therefore a representation of the object's motion.
Dot to Dot • The distance between dots on a ticker tape represents the object's position change during that time interval. A large distance between dots indicates that the object was moving fast during that time interval. A small distance between dots means the object was moving slow during that time interval. Ticker tapes for a fast- and slow-moving object are depicted below.
What else can you get from a ticker tape diagram? • The analysis of a ticker tape diagram will also reveal if the object is moving with a constant velocity or accelerating. A changing distance between dots indicates a changing velocity and thus an acceleration. A constant distance between dots represents a constant velocity and therefore no acceleration. Ticker tapes for objects moving with a constant velocity and with an accelerated motion are shown below.
Check your understanding • Ticker tape diagrams are sometimes referred to as oil drop diagrams. Imagine a car with a leaky engine that drips oil at a regular rate. As the car travels through town, it would leave a trace of oil on the street. That trace would reveal information about the motion of the car. Renatta Oyle owns such a car and it leaves a signature of Renatta's motion wherever she goes. Analyze the three traces of Renatta's ventures as shown below. Assume Renatta is traveling from left to right. Describe Renatta's motion characteristics during each section of the diagram. 1.
Answer • Renatta decelerates from a high speed to low speed until she is finally stopped. She remains at rest for a while and then gradually accelerates until the trace ends.
Answer • Renatta travels at a constant speed during the first time interval and then gradually accelerates until the trace ends.
Answer • Renatta moves with a constant speed in the first time interval. She then abruptly decelerates to a stop. She remains at rest for sometime and then moves with a constant speed, slower than the first speed.
Vectors and Diagrams Diagrams that show direction
Scalar and Vector REVISITED • Scalars are quantities which are fully described by a magnitude alone. • Vectors are quantities which are fully described by both a magnitude and a direction.
Check your understanding • Check Your Understanding • 1. To test your understanding of this distinction, consider the following quantities listed below. Categorize each quantity as being either a vector or a scalar. • Quantity • a. 5 m • b. 30 m/sec, East • c. 5 mi., North • d. 20 degrees Celsius • e. 256 bytes • f. 4000 Calories
Introduction • Vector diagrams are diagrams which depict the direction and relative magnitude of a vector quantity by a vector arrow. Vector diagrams can be used to describe the velocity of a moving object during its motion. For example, the velocity of a car moving down the road could be represented by a vector diagram.
How it works • In a vector diagram, the magnitude of a vector is represented by the size of the vector arrow. If the size of the arrow in each consecutive frame of the vector diagram is the same, then the magnitude of that vector is constant. The diagrams below depict the velocity of a car during its motion. In the top diagram, the size of the velocity vector is constant, so the diagram is depicting a motion of constant velocity. In the bottom diagram, the size of the velocity vector is increasing, so the diagram is depicting a motion with increasing velocity - i.e., an acceleration.
When can you use vector diagrams? • Vector diagrams can be used to represent any vector quantity. In future studies, vector diagrams will be used to represent a variety of physical quantities such as acceleration, force, and momentum. Be familiar with the concept of using a vector arrow to represent the direction and relative size of a quantity. It will become a very important representation of an object's motion as we proceed further in our studies of the physics of motion.
Distance v. Displacement • Distance and Displacement • Distance and displacement are two quantities which may seem to mean the same thing, yet have distinctly different definitions and meanings. • Distance is a scalar quantity which refers to "how much ground an object has covered" during its motion. • Displacement is a vector quantity which refers to "how far out of place an object is"; it is the object's change in position.
How far was the physics teacher displaced? • To test your understanding of this distinction, consider the following motion depicted in the diagram below. A physics teacher walks 4 meters East, 2 meters South, 4 meters West, and finally 2 meters North.
Quick Quiz • Now consider another example. The diagram below shows the position of a cross-country skier at various times. At each of the indicated times, the skier turns around and reverses the direction of travel. In other words, the skier moves from A to B to C to D. • Use the diagram to determine the resulting displacement and the distance traveled by the skier during these three minutes.
Answer • The skier covers a distance of • (180 m + 140 m + 100 m) = 420 m and has a displacement of 140 m, rightward.
Another Example • Now for a final example. A football coach paces back and forth along the sidelines. The diagram below shows several of coach's positions at various times. At each marked position, the coach makes a "U-turn" and moves in the opposite direction. In other words, the coach moves from position A to B to C to D. • What is the coach's resulting displacement and distance of travel? .
Speed v. Velocity Yes, there really is a difference!
What is speed? • Just as distance and displacement have distinctly different meanings (despite their similarities), so do speed and velocity. Speed is a scalar quantity which refers to "how fast an object is moving." A fast-moving object has a high speed while a slow-moving object has a low speed. An object with no movement at all has a zero speed.
Velocity • Velocity is a vector quantity. As such, velocity is "direction-aware." When evaluating the velocity of an object, one must keep track of direction. It would not be enough to say that an object has a velocity of 55 mi/hr. One must include direction information in order to fully describe the velocity of the object. For instance, you must describe an object's velocity as being 55 mi/hr, east. This is one of the essential differences between speed and velocity. Speed is a scalar and does not keep track of direction; velocity is a vector and is direction-aware.
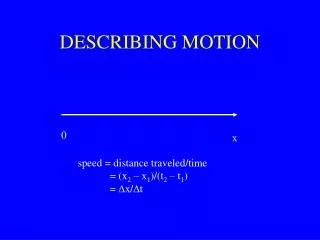
Average Speed v. Instantaneous • The instantaneous speed of an object is not to be confused with the average speed. Average speed is a measure of the distance traveled in a given period of time; it is sometimes referred to as the distance per time ratio. Suppose that during your trip to school, you traveled a distance of 5 miles and the trip lasted 0.2 hours (12 minutes). The average speed of your car could be determined as avg. speed = distance/time
For you to try: • While on vacation, Lisa Carr traveled a total distance of 440 miles. Her trip took 8 hours. What was her average speed?
Answer • To compute her average speed, we simply divide the distance of travel by the time of travel. • That was easy! Lisa Carr averaged a speed of 55 miles per hour. She may not have been traveling at a constant speed of 55 mi/hr. She undoubtedly, was stopped at some instant in time (perhaps for a bathroom break or for lunch) and she probably was going 65 mi/hr at other instants in time. Yet, she averaged a speed of 55 miles per hour.
Another walk by the physics teacher • Now let's try a little more difficult case by considering the motion of that physics teacher again. The physics teacher walks 4 meters East, 2 meters South, 4 meters West, and finally 2 meters North. The entire motion lasted for 24 seconds. Determine the average speed and the average velocity.
And the Answer is… • The physics teacher walked a distance of 12 meters in 24 seconds; thus, her average speed was 0.50 m/s. However, since her displacement is 0 meters, her average velocity is 0 m/s. Remember that the displacement refers to the change in position and the velocity is based upon this position change. In this case of the teacher's motion, there is a position change of 0 meters and thus an average velocity of 0 m/s.
Return of the Skier Example • Here is another example similar to what was seen before in the discussion of distance and displacement. The diagram below shows the position of a cross-country skier at various times. At each of the indicated times, the skier turns around and reverses the direction of travel. In other words, the skier moves from A to B to C to D. • Use the diagram to determine the average speed and the average velocity of the skier during these three minutes.
Answer • The skier has an average speed of • (420 m) / (3 min) = 140 m/min and an average velocity of • (140 m, right) / (3 min) = 46.7 m/min, right
Back to the coach example • And now for the last example. A football coach paces back and forth along the sidelines. The diagram below shows several of coach's positions at various times. At each marked position, the coach makes a "U-turn" and moves in the opposite direction. In other words, the coach moves from position A to B to C to D. • What is the coach's average speed and average velocity? When finished, click the button to view the answer
Answer • Seymour has an average speed of • (95 yd) / (10 min) = 9.5 yd/min and an average velocity of • (55 yd, left) / (10 min) = 5.5 yd/min, left
Summary • In conclusion, speed and velocity are kinematic quantities which have distinctly different definitions. Speed, being a scalar quantity, is the distance (a scalar quantity) per time ratio. Speed is ignorant of direction. On the other hand, velocity is direction-aware. Velocity, the vector quantity, is the rate at which the position changes. It is the displacement or position change (a vector quantity) per time ratio.
Acceleration Change in Velocity during a Time interval