Download
1 / 51
510 likes | 644 Views
Shear and Buoyancy Parameters for California Tornadoes 1951—2011. Chris Stumpf Masters Proposal. Thesis Committee: Prof. John Monteverdi (Advisor) Prof. Dave Dempsey Prof. Oswaldo Garcia. Outline of Proposal. Introduction Background and Previous Work Research Objectives

E N D
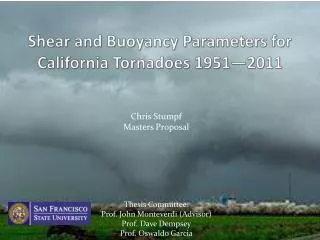
Shear and Buoyancy Parameters for California Tornadoes 1951—2011 Chris Stumpf Masters Proposal Thesis Committee: Prof. John Monteverdi (Advisor) Prof. Dave Dempsey Prof. Oswaldo Garcia
Outline of Proposal • Introduction • Background and Previous Work • Research Objectives • Project Plan and Methodology • Timeline
California TornadoClimatology • Peak in March • Mainly occur during the peak heating hours Blier and Batten 1994
Blier and Batten noted four areas of high tornado frequency North-Central Coast Central Valley LA Basin Desert Region
The Fujita Scale • Developed in 1971 by Ted Fujita • Way to estimate wind speeds inside a tornado without direct observations • Done by investigating the damage to structures and objects in the tornado path
Minor Damage Moderate Damage Considerable Damage Severe Damage Extreme Damage to Near Total Destruction Massive Damage
Outline of Proposal • Introduction • Background and Previous Work • Research Objectives • Project Plan and Methodology • Timeline
Buoyancy • Observed in the atmosphere by small bubbles of air spontaneously rising for certain thermodynamic profiles • One measure of buoyancy is called Convective Available Potential Energy (CAPE) is required for thunderstorm development • CAPE values in California are lower than those typically found in the Great Plains
Buoyancy • While buoyancy is necessary for thunderstorms, it does not necessarily relate to tornado formation • There are additional effects unrelated to buoyancy that induce thunderstorm rotation and ultimately, formation of tornadoes Maximum, 75th, and 25th percentile and minimum values of SBCAPE observed for the null, F0, and F1/F2 bins. Monteverdi et al. 2003
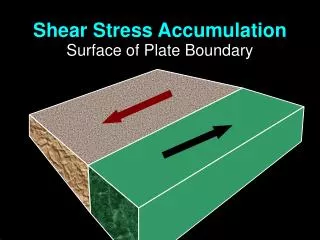
Wind Shear • Additional effects that both augment updrafts and induce rotation relate to the vertical change in wind direction and wind speed • Mathematically, the vertical wind shear is a simple expression = Wind Shear
Wind Shear and Supercells • Certain wind shear profiles are associated with pressure perturbations that augment the updraft strength of thunderstorms, but more importantly encourage updraft rotation. • Such rotating updrafts are called mesocyclones and thunderstorms with persistent and deep mesocyclones are called supercells.
Previous Work • Braun and Monteverdi 1991 – Sept. 1986 tornado environment • Weak CAPE but strong wind shear values similar to those found elsewhere in the country • Blier and Batten 1994 – California tornado climatology 1950-1992 • Monteverdi and Quadros 1994 – Buoyancy and shear parameters associated with three tornado episodes in Dec. 1992 • Lipari and Monteverdi 2000 - Shear profiles of California tornadoes from 1990-1994 consistent with supercell thunderstorms found in the Great Plains • Monteverdi et al. 2003 – Strong low level shear (0-1 km) is a good indicator of tornadic potential
Outline of Proposal • Introduction • Background and Previous Work • Research Objectives • Project Plan and Methodology • Timeline
Objectives • Build upon previous research of shear and buoyancy parameters of California tornadoes to include 1951-2011 • Perform a forensic meteorological analysis of two of the most damaging tornadoes in the California record, the 1951 Sunnyvale F2 tornado and the 1983 LA Convention Center F2 tornado, both of which were poorly documented meteorologically.
Objectives • Build upon previous research of shear and buoyancy parameters of California tornadoes to include 1951-2011 • Perform a forensic meteorological analysis of two of the most damaging tornadoes in the California record, the 1951 Sunnyvale F2 tornado and the 1983 LA Convention Center F2 tornado, both of which were poorly documented meteorologically.
Case Studies • Before the 1980’s, it is recognized (as a national issue) that the F-scale rating of tornadoes was underestimated. • It is documented in the literature that this has been a particularly major issue in the rating of California tornadoes.
LA Convention Center F2 Tornado Taken from The Los Angeles, California Tornado of March 1, 1983
Outline of Proposal • Introduction • Background and Previous Work • Research Objectives • Project Plan and Methodology • Timeline
Radiosondes • Instrument packages lofted by balloons that transmit the vertical profile of weather information known as a “sounding.” • Launched at 1200 and 0000 GMT everyday • The National Climatic Data Center (NCDC) maintains an archive of these soundings
SurfaceObservations • Hourly surface observations of T, Td, WS, and WD • Archive of hourly surface data is maintained by NCDC
Methodology • Use ArcGIS to link a tornado event with a particular balloon launch • Use ArcGIS to match a tornado event to the closest surface observation station • I will use readily available software to modify the surface observations of each sounding to resemble the hourly observations from each site
Timeline • Early June: Pilot study of 1980’s shear and buoyancy parameters completed • Summer 2011: Sounding surface data modification for all events • Fall 2011: Analyze shear and buoyancy parameters • December 2011: First draft of thesis submitted to advisor • Spring 2012: Submit thesis to advisor and work on submitting a paper to the AMS
Previous Work • Braun and Monteverdi 1991 – Sept. 1986 tornado environment • Weak CAPE but strong wind shear values similar to those found elsewhere in the country • Blier and Batten 1994 – California tornado climatology 1950-1992 • Monteverdi and Quadros 1994 – Buoyancy and shear parameters associated with three tornado episodes in Dec. 1992 • Lipari and Monteverdi 2000 - Shear profiles of California tornadoes from 1990-1994 consistent with supercell thunderstorms found in the Great Plains • Monteverdi et al. 2003 – Strong low level shear (0-1 km) is a good indicator of tornadic potential
Atmospheric Profiling • Radiosondes (weather balloons) are launched everyday at 12 and 00 UTC • Records a vertical profile of: • Temperature • Dewpoint • Wind direction and speed • Pressure
Previous Work • Braun and Monteverdi 1991 – Sept. 1986 tornado environment • Weak CAPE but strong wind shear values similar to those found elsewhere in the country • Blier and Batten 1994 – California tornado climatology 1950-1992 • Monteverdi and Quadros 1994 – Buoyancy and shear parameters associated with three tornado episodes in Dec. 1992 • Lipari and Monteverdi 2000 - Shear profiles of California tornadoes from 1990-1994 consistent with supercell thunderstorms found in the Great Plains • Monteverdi et al. 2003 – Strong low level shear (0-1 km) is a good indicator of tornadic potential
Future Work • Use Rapid Update Cycle (RUC) forecast model gridded archives to compare soundings generated by the model to my method of sounding surface modification to check for validity and accuracy • RUC model data available from 2002—Present
Wind Shear • Mathematically, the vertical wind shear is a simple expression • Easy to calculate using Excel or Matlab, or readily available software packages = Wind Shear
Wind Shear • Mathematically, the vertical wind shear is a simple expression • Easy to calculate using Excel or Matlab, or readily available software packages = Wind Shear
Buoyancy • Evidenced in the atmosphere by small bubbles of air spontaneously rising for certain thermodynamic profiles • One measure of buoyancy is called Convective Available Potential Energy (CAPE) is required for thunderstorm development • CAPE values in California are lower than those typically found in the Great Plains
References • Hales, J. E., Jr., 1985 Synoptic features associated with Los Angeles tornado occurrences. Bull. Amer. Meteor. Soc., 66, 657-662. • Braun, S.A. andJ.P. Monteverdi, 1991: An investigation of a mesocyclone-induced tornado occurrence in northern California. Wea. Forecasting, 6, 13-31. • Monteverdi, J. P., C. A. Doswell, and G. S. Lipari, 2003: Shear Parameter Thresholds for Forecasting Tornadic Thunderstorms in Northern and Central California. Wea. Forecasting, 18, 357-370
What is Shear? Speed Shear Directional Shear Strong vertical shear is the combination of strong speed shear and veering directional shear
California tornadoes are part of the climatological history Sacramento Tornadoes February 2005 From sacbee.com, Photo by Matthew Adams From sacbee.com, Photo by Stuart Hooper
Riverside, CA May 2008 From LA Times, Photo by Michael Ritter
Sounding Surface Modification • To obtain buoyancy and shear parameters for all 371 cases • I will use readily available software to modify the surface observations of each sounding to resemble the hourly observations from each site • This process will provide a wind shear profile and a buoyancy value for each event
Remains of a large truck wrapped around telephone after an F5 tornado
April 4th, 1974 Xenia, Ohio F5 Photo by Fred Stewart, courtesy of NOAA
Morning sounding before tornado event • 12Z sounding from Oakland on 12/11/83
Modified 12Z Sounding using surface observations • 12Z sounding from Oakland on 12/11/83
Synoptic Pattern Charateristics • Strong jet at 300 mb entering California • Upward vertical motions created by quasi-geostrophic forcing • Closed circulation centers from the surface to 500 mb and located generally offshore • Increasing wind speeds and veering of the wind with height • Majority of tornadoes occurred well behind cold front Taken from Braun and Monteverdi 1991
Surface Characteristics of Central Valley Tornadoes • Quasi-stationary trough axis located on lee side of coastal ranges • Creates S to SE flow in valley • Advection of warmer temperatures into valley • Enhances low level wind shear Taken from Braun and Monteverdi 1991
Surface Characteristics of LA Basin Tornadoes • SE flow ahead of surface trough axis • Due to frictional convergence • Convergence associated with local topography • Mountains surrounding the LA Basin • Islands located offshore create eddies in wind flow Surface low pressure and wind barbs Taken from Hales 1985