Download
1 / 4
50 likes | 225 Views
Quebec Smoke: NASA Goddard Micro Pulse Lidar. GOES July 7, 02. Vertical data are crucial for PM transport MPL LIDAR data on July 7 show smoke descending from 3 km to the surface. MPL Lidar Network. 02 July 6. July 7. July 8. Elevated Smoke Plume over NY City, May 31, 2001. AERONET AOT.

E N D
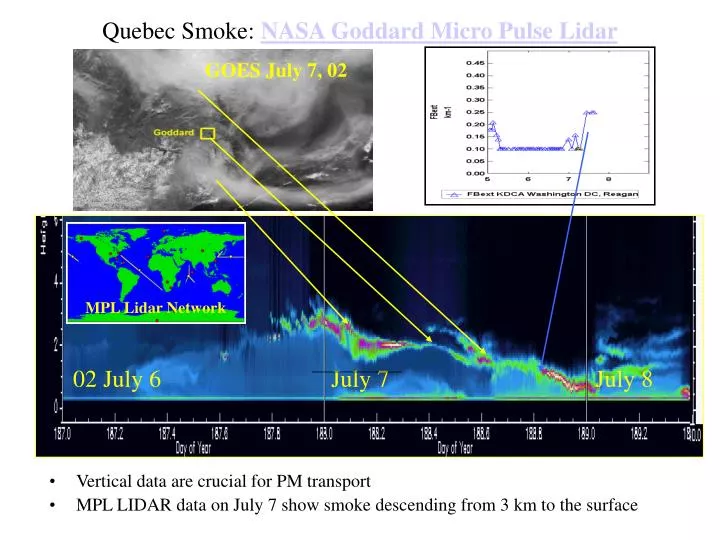
Quebec Smoke: NASA Goddard Micro Pulse Lidar GOES July 7, 02 • Vertical data are crucial for PM transport • MPL LIDAR data on July 7 show smoke descending from 3 km to the surface MPL Lidar Network 02 July 6 July 7 July 8
Elevated Smoke Plume over NY City, May 31, 2001 AERONET AOT SeaWiFS, May 30, 2001 • Some smoke and haze plumes are above the surface layer, others are within • Elevated layers can be inferred from the combination of surface and integral sensors HOURLY PM2.5, NY City SeaWiFS, May 31, 2001
Elevated Asian Dust Layer over Washington DC • The ‘Perfect Dust Storm’ in Gobi, April 7, 2001 • Transcontinental dust transport is well documented • Goddard MP Lidar documents dust layer • AERONET confirms by low (dust-like) the Angstrom exp.
METAR Surface Met Data, 1300 US StationsData accessible real time though D Voyager, archived at CAPITA since June 2002 • Weather Params:Temp, Dewp, Press., Precip, WindDir, WindSpeed, Bext • Hourly Winds illustrate station density, coverage Click on image for 1 day for animation