Download
1 / 24
240 likes | 366 Views
High Performance MALDI MS, MS/MS, and Multiplexed MS/MS Tissue Imaging . MSACL 2014 US March 1 - 5, 2014, San Diego, CA. Boone M. Prentice 1 , Kevin M. Hayden 2 , Marvin L. Vestal 2 , Richard M. Caprioli 1

E N D
High Performance MALDI MS, MS/MS, and Multiplexed MS/MS Tissue Imaging MSACL 2014 US March 1 - 5, 2014, San Diego, CA Boone M. Prentice1, Kevin M. Hayden2, Marvin L. Vestal2, Richard M. Caprioli1 1Mass Spectrometry Research Center, Department of Biochemistry, Vanderbilt University, Nashville, TN 37235 2SimulTOF Systems, Sudbury, MA 01776
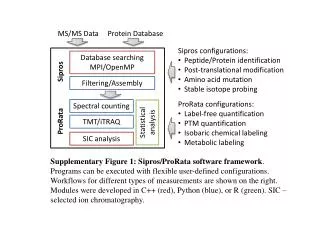
Why Imaging Mass Spectrometry? IMS combines molecular specificity with location cortex Rat Kidney medulla 783 m/z 773 m/z 704 m/z 726 m/z 733 m/z 742 m/z 761 m/z 821m/z 811m/z 805 m/z 797 m/z 787 m/z 809 m/z 849 m/z The multiplexed nature of MS analysis allows for the parallel acquisition of many different molecular signals, each which can be reconstructed to give a molecular picture.
Imaging Mass Spectrometry Matrix application Matrix-Assisted Laser Desorption/Ionization Sample Preparation Matrix SA – proteins/peptides DHB –proteins/peptides CHCA- lipids/peptides DAN– lipids Application Method Spraying (manual, robotic) Sublimation Spotting (robotic) Laser ………… ………… ………… ………… ………… ………… Lipid & Protein Ion Images ………… ………… Data Processing Images for individual m/z values integrated over all pixels MS spectrum for each x, y coordinate (pixel)
IMS Performance Considerations Traditional MS Figures of Merit Mass resolving power: m/Δm Mass accuracy: difference between measured mass and exact mass Sensitivity: overall response of the instrument for a given analyte Dynamic range: range of detectable signals MS/MS capabilities: ability to perform fragmentation experiments Special IMS Considerations Spatial resolution: distance between two neighboring pixels on the sample surface Throughput (acquisition rate): number of spectra acquired per unit time Data/file sizes: storage costs and processing abilities
MALDI Imaging Platforms • High mass resolution (m/Δm = 20,000) • High repetition rate laser (5 kHz Nd:YLF) • High digitizer acquisition rate (50-100 pixels/sec) • Continuous laser raster sampling • MS/MS Next Generation MALDI TOF SimulTOF 200 Combo & 300 Tandem MALDI TOF BrukerDaltonicsAutoflex II LIT Thermo LTQ XL FT-ICR Bruker 9.4 T FTMS IM Q-TOF Waters Synapt G-2 J.M Spraggins and R.M. Caprioli, J. Am. Soc. Mass Spectrom.2011, 22, 1022-1031.
Performance Tradeoffs Low Spatial Resolution (>100 μm) High Spatial Resolution (<10 μm) Minutes Hours Acquisition Time 1 x 10⁸ Signal Intensity 1 x 10⁵ File Size <5 GB > 10GB
#Pixels = f(Spatial Resolution, Area) High-spatial resolution and/or large area IMS experiments can require prohibitive analysis times. 25 pixels 2,500 pixels
Pixel Size: The Importance of Speed ~21,000 pixels/3hr MALDI TOF ~9,800 pixels/3hr LIT ~7,700 pixels/3hr FT-ICR ~7,200 pixels/3hr IM Q-TOF
High Speed MALDI TOF ~345,000 pixels/3hr Next Generation MALDI TOF ~21,000 pixels/3hr MALDI TOF ~9,800 pixels/3hr LIT ~7,700 pixels/3hr FT-ICR ~7,200 pixels/3hr IM Q-TOF
MS Protein Imaging Sample: +Mouse Kidney (infected w/ S. aureus) Lateral Spatial Resolution: 25 µm Vertical Step: 50 µm Wash, Matrix:Carnoy’s, CHCA/DHB mix Laser Rep. Rate: 1000 Hz Acquisition Rate: 20 pixels/second Pixels: 15,940 pixels Analysis Time: ~20 minutes ~10,160 m/z ~15,000 m/z 1 mm Red: S100A8 protein Green:Hemoglobin alpha chain Abscesses
MS Lipid Imaging Average spectrum across tissue Sample: +Rat Brain Lateral Spatial Resolution: 50 µm Vertical Step: 50 µm Matrix: DAN Laser Rep. Rate: 1000 Hz Acquisition Rate: 20 pixels/second Pixels: 39,073 pixels Analysis Time: ~40 minutes corpus callosum fornix striatum ventricle 735 m/z 778 m/z anterior commissure 1 mm 1 mm
The Need for High Mass Resolution Average spectrum across tissue 1 mm 869.25 ± 0.25 m/z Sample: +Rat Brain (lipids) Lateral Spatial Resolution: 25 µm Vertical Step: 25 µm Matrix: CHCA Laser Rep. Rate: 5000 Hz Acquisition Rate: 100 pixels/second Pixels: 178,154 pixels Analysis Time: ~90 minutes
The Need for High Mass Resolution 869.25 ± 0.25 m/z Sample: +Rat Brain (lipids) Lateral Spatial Resolution: 25 µm Vertical Step: 25 µm Matrix: CHCA Laser Rep. Rate: 5000 Hz Acquisition Rate: 100 pixels/second Pixels: 178,154 pixels Analysis Time: ~90 minutes ~12,000 FWHM resolution at 869 m/z
The Need for High Mass Resolution 869.13 869.32 Δ = 0.19 m/z cortex thalamus corpus callosum hippocampus 1 mm 869.32 ± 0.05 m/z 1 mm 869.13 ± 0.05 m/z
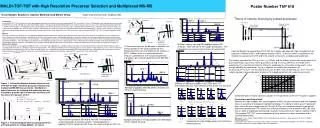
MALDI TOF/TOF V Velocity and Space Focus Vg Collision Cell Ion Accelerator Vp Timed Ion Selector Detector • High resolution timed ion selector (<5 Da) • Collision cell for efficient fragmentation • High repetition rate laser (5 kHz Nd:YLF) • High digitizer acquisition rate (50-100 pixels/sec) • Continuous laser raster sampling MS/MS can provide a way to distinguish isobaric species and give sequence information on an analyte of interest.
MS Lipid Imaging 869.2 ± 0.4 m/z 1 mm Sample: +Rat Brain (lipids) Lateral Spatial Resolution: 50 µm Vertical Step: 50 µm Matrix: DAN Laser Rep. Rate: 1000 Hz Acquisition Rate: 20 pixels/second Pixels: 51,120 pixels Analysis Time: ~45 minutes
MS/MS Lipid Imaging MS/MS Precursor:869.2 Sample: +Rat Brain (lipids) Lateral Spatial Resolution: 50 µm Vertical Step: 50 µm Matrix: DAN Laser Rep. Rate: 1000 Hz Acquisition Rate: 20 pixels/second Pixels: 48,441 pixels Analysis Time: ~45 minutes hippocampus 1 mm 869 → 39 m/z 869 → 223 m/z 1 mm
MS/MS Drug Imaging Sample: +Rat Liver (synthetically does with Rifampicin, 400 mg liver immersed in 200 µM RIF solution for 100 hrs) Lateral Spatial Resolution: 50 µm Vertical Step: 50 µm Matrix: THAP Laser Rep. Rate: 1000 Hz Acquisition Rate: 20 pixels/sec Pixels: 14,192 pixels Analysis Time: ~15 minutes 100% 0% CID [M-H]- [M-H-424]- 821 m/z 397 m/z 1 mm 821 → 397 m/z
“Multiplexed” MS/MS Analysis Collision Cell Ion Accelerator Timed Ion Selector • High resolution timed ion selector (<5 Da) • Selection of multiple precursor ions allows for multiple MS/MS transitions to be performed in a single laser shot. Monitoring MS/MS transitions is useful, but throughput is limited when only examining a single precursor ion.
“Multiplexing” Sample: +Rat Brain (lipids) Lateral Spatial Resolution: 50 µm Vertical Step: 50 µm Matrix: DAN Laser Rep. Rate: 1000 Hz Acquisition Rate: 20 pixels/second Pixels: 47,204 pixels Analysis Time: ~40 minutes 827m/z 735 m/z MS/MS of 735 m/z AND 827 m/z MS Image corpus callosum hippocampus 827m/z 735 m/z thalamus 735 m/z, 827 m/z cortex 1 mm
Multiplexed Imaging MS/MS of 735 m/z AND 827 m/z 827m/z 735 m/z hippocampus MS/MS Images 827m/z 735 m/z corpus callosum 735 → 184 m/z 827 → 767 m/z 1 mm 1 mm
Conclusions • Going from hours to minutes: High speed IMS produces high quality molecular images. • Making the unseen, seen: Isobaric or near isobaric species require special consideration. • High resolution MS • MS/MS • Informing biology: Coupled with the multiplexed nature of MS-based acquisition, the high throughput methodologies described herein offer viable means for studying complex biological systems in situ.
Acknowledgements Mass Spectrometry Research Center SimulTOF Systems Christina Hsieh Vestel George Mills Kenneth Parker Funding NIH T32 ES007028 NIH/NIGMS 5P41 GM103391-03 MSACL Young Investigator Travel Award Richard Caprioli Kevin Schey Jeremy Norris Michelle Reyzer David Hachey Kristie Rose Andre Zavalin Jeff Spraggins Raf Van de Plas Erin Seeley Junhai Yang Peggi Angel Jere Compton Jamie Allen Brian Hachey Audra Judd Lisa Manier David Anderson Megan Gessel Dhananjay Sakrikar Domenico Taverna Kerri Grove Jessica Moore David Rizzo Chad Chumbley Jamie Wenke Faizan Zubair Kyle Floyd Monika Murphy