Download
1 / 2
20 likes | 139 Views

E N D
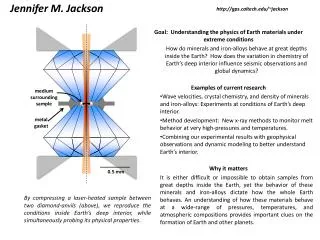
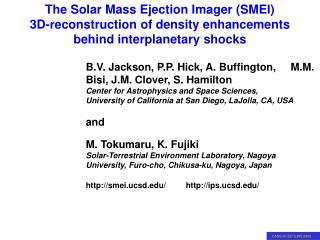
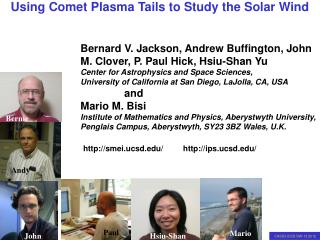
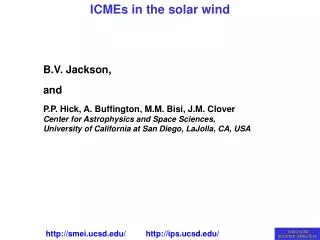
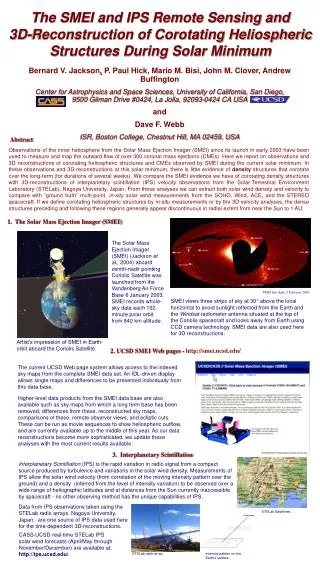
Interplanetary Scintillation (IPS) is the rapid variation in radio signal from a compact source produced by turbulence and variations in the solar wind density. Measurements of IPS allow the solar wind velocity (from correlation of the moving intensity pattern over the ground) and a density (inferred from the level of intensity variation) to be observed over a wide range of heliographic latitudes and at distances from the Sun currently inaccessible by spacecraft - no other observing method has the unique capabilities of IPS. SMEI first-light, 2 February 2003. Artist’s impression of SMEI in Earth-orbit aboard the Coriolis Satellite. The SMEI and IPS Remote Sensing and 3D-Reconstruction of Corotating Heliospheric Structures During Solar Minimum Bernard V. Jackson, P. Paul Hick, Mario M. Bisi,John M. Clover, Andrew Buffington Center for Astrophysics and Space Sciences, University of California, San Diego, 9500 Gilman Drive #0424, La Jolla, 92093-0424 CA USA and Dave F. Webb ISR, Boston College, Chestnut Hill, MA 02459, USA Abstract Observations of the inner heliosphere from the Solar Mass Ejection Imager (SMEI) since its launch in early 2003 have been used to measure and map the outward flow of over 300 coronal mass ejections (CMEs). Here we report on observations and 3D reconstructions of corotating heliospheric structures and CMEs observed by SMEI during the current solar minimum. In these observations and 3D-reconstructions at this solar minimum, there is little evidence of density structures that corotate over the long-term (for durations of several weeks). We compare the SMEI evidence we have of corotating density structures with 3D-reconstructions of interplanetary scintillation (IPS) velocity observations from the Solar-Terrestrial Environment Laboratory (STELab), Nagoya University, Japan. From these analyses we can extract both solar wind density and velocity to compare with “ground truth” multi-point, in-situ solar wind measurements from the SOHO, Wind, ACE, and the STEREO spacecraft. If we define corotating heliospheric structures by in-situ measurements or by the 3D velocity analyses, the dense structures preceding and following these regions generally appear discontinuous in radial extent from near the Sun to 1 AU. 1. The Solar Mass Ejection Imager (SMEI) The Solar Mass Ejection Imager (SMEI) (Jackson et al., 2004) aboard zenith-nadir pointing Coriolis Satellite was launched from the Vandenberg Air Force Base 6 January 2003. SMEI records whole-sky data each 102-minute polar orbit from 840 km altitude. SMEI views three strips of sky at 30 above the local horizontal to avoid sunlight reflected from the Earth and the Windsat radiometer antenna situated at the top of the Coriolis spacecraft and looks away from Earth using CCD camera technology. SMEI data are also used here for 3D reconstructions. 2. UCSD SMEI Web pages - http://smei.ucsd.edu/. The current UCSD Web page system allows access to the indexed sky maps from the complete SMEI data set. An IDL-driven display allows single maps and differences to be presented individually from this data base. Higher-level data products from the SMEI data base are also available such as sky maps from which a long term base has been removed, differences from these, reconstructed sky maps, comparisons of these, remote observer views, and ecliptic cuts. These can be run as movie sequences to show heliospheric outflow, and are currently available up to the middle of this year. As our data reconstructions become more sophisticated, we update these analyses with the most current results available. 3. Interplanetary Scintillation Data from IPS observations taken using the STELab radio arrays, Nagoya University, Japan, are one source of IPS data used here for the time-dependent 3D-reconstructions. STELab Baselines. CASS-UCSD real-time STELab IPS solar wind forecasts (April/May through November/December) are available at: http://ips.ucsd.edu/. STELab radio array. Intensity pattern on the Earth’s surface.
4. UCSD 3D-reconstruction technique Heliospheric Analyses:Heliospheric Computer-Assisted Tomography (C.A.T.) analyses (right) provide the line-of-sight segment distributions for consecutive half-day Carrington Coordinate inner boundaries for each sky location during mid-April 2008 from SMEI observations (right). Line-of-sight weighting and location are inverted on this inner boundary to provide a 3D solar wind model to fit observational parameters. SMEI Precision Photometry allows the UCSD 3D reconstruction. The outward-flowing solar wind structure follows very specific physics as it moves outward from the Sun and perspective views as the structures pass the observer. Heliospheric line-of-sight weighting:Line-of-sight weighting values for each sky location in SMEI. When SMEI Thomson-scattering data are used in the current UCSD time-dependent inversion, several hundred thousand lines of sight over a month-long time interval are used, and resolutions over the whole heliosphere at half-day cadences and digital resolutions of 6.7˚ x 6.7˚ in heliographic coordinates are available. 5. 3D-reconstructions During Solar Minimum Line of Sight Crossing Error Example- the WHI Period: The numbers of line-of sight segments per resolution element over time are projected outward from the source surface and shown on the right (below) for the SMEI density reconstructions shown as ecliptic cuts. A Tiny CME During the WHI Period: A small CME that was observed to the north in the SMEI data is shown reconstructed in this set of meridional cuts that show both density (left) and velocity (right). There are many such events during this period. 3D- reconstructions – Difference Plots: 3D-reconstructed Sky Maps where a map 12 hours prior to the current is differenced show a wealth of heliospheric structure during the WHI interval. This structure generally has characteristics ascribed to corotating features when displayed as j-plots (left). These features often correspond to those observed in the STEREO HI-1 &2 j-plots. 3D- reconstructions – Sky Map Views: Fisheye sky map views of both velocity and brightness show structures that present an Archimedean spiral structure in velocity (below left), but that are more variable and segmented in brightness (below right) and show little corotational structure. Archimedean spiral East (90º) West (270º) 6. Summary and Future 3D- reconstructions – A CME following the WHI interval: The 26 April 2008 CME observed near the Sun in a LASCO difference image is shown in the SMEI reconstructions as a difference image, and in a density ecliptic cut that shows the CME interrupts the corotating density structure segments. The CME is very difficult to discern at large solar elongations. • The dense structures preceding and following high velocity regions that corotate generally appear discontinuous in radial extent from near the Sun to 1 AU. • These same structures in difference images form an ensemble of features that are generally termed “corotating”. • The SMEI reconstructions and these analyses compare fairly well with the twin STEREO spacecraft HI-1 & 2 analyses of corotating structures, but SMEI analyses are somewhat more sensitive to features that present beyond about 60º elongation. • SMEI analyses in comparison with STEREO thus show how the structures viewed near the Sun proceed to the outer heliosphere. • Future studies will follow sample measured features in these differences from their origin on the Sun until they disappear in the SMEI field of view. CME CME CME Primary Reference: Jackson, B.V., A. Buffington, P.P. Hick, R.C. Altrock, S. Figueroa, P. Holladay, J.C. Johnston, S.W. Kahler, J. Mozer, S. Price, R.R. Radick, R. Sagalyn, D. Sinclair, G.M. Simnett, C.J. Eyles, M.P. Cooke, S. J. Tappin, T. Kuchar, D. Mizumo, D.F. Webb, P. Anderson, S.L. Keil, R. Gold, and N.R. Waltham (2004), “The Solar Mass Ejection Imager (SMEI) mission”, Solar Phys. 225, 177. LASCO difference image