Download
1 / 16
160 likes | 225 Views
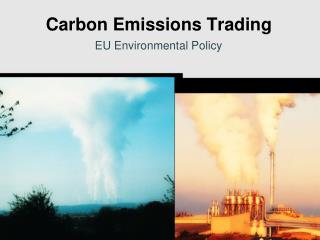
WP 5 : Joint Implementation and Emissions Trading in Eastern Europe. Jin Lee, Policy Associate Jake Schmidt, International Team Manager ******** 30 November 2006 Brussels, Belgium. Overview of WP 5. Goals:

E N D
WP 5 : Joint Implementation and Emissions Trading in Eastern Europe Jin Lee, Policy Associate Jake Schmidt, International Team Manager ******** 30 November 2006 Brussels, Belgium
Overview of WP 5 • Goals: • To assess the scope of on emissions and allowance allocation under the Kyoto and EU ETS for Eastern European countries • To assess cost and emission reduction potentials for Joint Implementation (JI) projects in Eastern European countries • To examine compatibility of planned and existing trading schemes for other pollutants (SO2 and NOx) with the EU ETS • Methodologies: • Analyzed European Environment Agency and DG TREN data on current and projected emissions of Eastern European countries • Examined the National Allocation Plans (NAPs) - Phsse I NAPs and Phase II NAPs (assessments and proposed) • Assessed Joint Implementation (JI) potential using GAINS model • Reviewed the Dutch NOx Trading Scheme, Slovakian SO2 Emissions Trading Programme, and Swedish NOx Charge System
Most on Path to Meet Their Kyoto Targets, but what about EU ETS Phase II? • Many of these countries expected to be below their base year levels in 2010 with existing Policies and Measures (except Slovenia) • Total surplus of emissions (difference between emissions and Kyoto target) will decline from over 30% in 2003 to 5-9% in 2010 • Nevertheless, Eastern European countries will likely have excess AAUs for sale: not a surprise • Greatest net surplus in Czech Republic, Poland and Estonia • More stringent allocations for Phase II may require Eastern European countries to keep their emissions at the current levels, whether or not they may be below Kyoto targets. • Yesterday, EC kept the Phase II NAPs for Latvia, Lithuania, Malta, and Slovakia at a level similar or lower to those in Phase I.
Modeling Emission Reduction Potentials of Eastern European Countries • Used the Greenhouse Gas and Air Pollution Interactions and Synergies (GAINS) Model v. 1 from IIASA which provided the most comprehensive data on mitigation options and costs in Eastern European countries • Modeled 8 countries • New EU Member States: Poland, Czech Republic, Slovakia, and Hungary • Accession Countries (or Candidate Countries): Bulgaria and Romania • Russia and Ukraine • Considering issues of double-counting CO2 reduction for countries in (or likely to be in) the EU ETS, GAINS only considered non-CO2 gases from these countries • Both CO2 and non-CO2 gasses are considered for Russia and Ukraine • Assessed marginal abatement cost (MAC) curves
Reality Check: Emission Reduction Potential vs. JI Potential • Conducted “on-the-ground” case study in Poland to compare GAINS mitigation options with practicalities of JI • e.g., project size, existing methodologies in CDM, diffusion of reductions • Majority of F-gases emission in Poland comes from dispersed sources and does not typically lend itself easily to JI • To date, there are no known JI projects implementing abatement of these gases. For these reasons, the emissions reduction opportunities in F-gases was left out of this consideration. • Of all the N2O abatement technical measures considered by the GAINS model, only N2O abatement technologies from nitric acid production can be considered as a potential JI project in Poland. • For CH4 abatement, reduction of methane from coal mining and reduction of methane from landfills involve technologies recognized by approved CDM methodologies.
Reflecting “Reality” Concerns to JI Potential • Modified GAINS results based upon Poland case study and other realities of JI: • All CO2 emissions reductions from Russia and Ukraine were considered potentially JI eligible. • Only reduction of N2O from nitric acid and adipic acid production was included for all countries. • For CH4, only reductions from coal mining, landfill gas recovery, capture of methane from oil and gas production, flaring instead of venting of gas in refineries, and biogas from manure management was included for all countries • For F-Gas emissions reductions, no options were included • For all feasible options, the full technical potential of GAINS was included • Only emissions reductions at less than €30 per ton CO2e are shown
JI Potential for All Countries • 108 mtCO2e at < €10 per ton 124 mtCO2e at < €20 per ton
Potential JI Options in Eastern Europe • Low- and medium-cost options: 108 mtCO2e at < €10 per ton • Coal bed methane recovery: 6.5 mtCO2e at a net savings • Adipic and nitric acid plant: 7.7 mtCO2e at €0.4 per tCO2e • Farm scale methane capture: 5.5 mtCO2e at €10 per tCO2e • High-cost options • fuel switching and industry e-saving measures in Russia and Ukraine. • In comparison, the JI project pipeline as of October 2006 showed projects totaling 16 million tCO2e per year from these countries. • Lower volume likely due to several reasons including transaction costs, in-country capacity for JI development, etc.
Emissions Trading Systems Not Widely Used for Conventional Pollutants in Europe • National Emissions Ceilings (NECs): a “command-and-control” type EU directives for member states to limit SO2, NOx, PM, and lead • Emissions Trading Systems are not widely used for conventional pollutants in Europe • Dutch NOx Trading Programme (2005): • More than 90% of the entrants are also under the EU ETS • similar design and legal provision with EU ETS • Difference: ex-post allocation and less flexibile in geographical scope and tradability • Slovakian SO2 Emissions Trading Programme (1998) • Absolute cap on large sources (greater than 50 MW thermal input) • Swedish NOx Charge System (1992) • Not an ETS, but has some components similar to output-based trading programs • €4 per 1 kg of NOx emission
Issues of Concern for Designing an ETS for Conventional Pollutants • Timing, stringency, regulatory structure, and compatibility with the EU ETS is crucial • Similar discussion in the US on the design of a CO2 ETS that would be compatible to SO2 and NOx trading under the Acid Rain Program • How do firms respond to command-and-control programs for one type of emissions source and cap-and-trade programs for other? • Are investment decisions being made to address one type of emission source having impacts on firm’s ability to comply with controls for another source? Positive or Negative? • Are allowance prices for CO2 driving those of conventional pollutants or vice versa? • If installation coverage is different between the two systems, has this brought about any issues such as investment decisions, administrative complexity, compliance, etc?