Download
1 / 5
50 likes | 182 Views
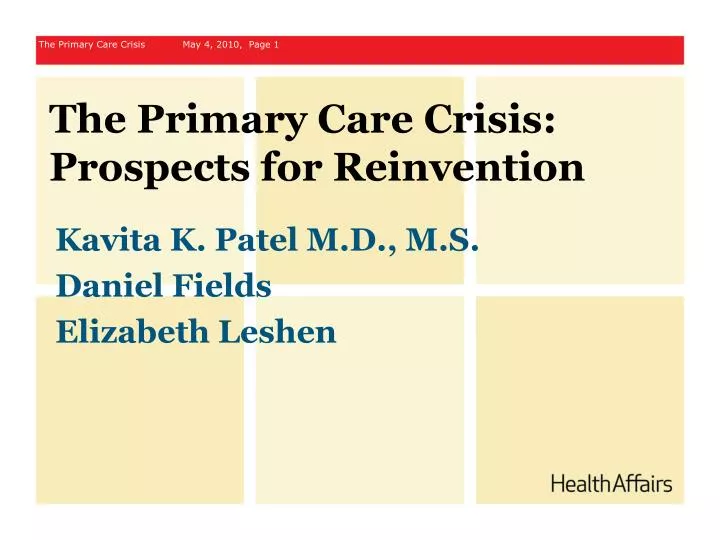
The Primary Care Crisis May 4, 2010, Page 1. The Primary Care Crisis: Prospects for Reinvention . Kavita K. Patel M.D., M.S. Daniel Fields Elizabeth Leshen. The Primary Care Crisis, Page 2. The Promise of Health Reform. Comparison of Successful Medical Homes.

E N D
The Primary Care Crisis May 4, 2010, Page 1 The Primary Care Crisis: Prospects for Reinvention Kavita K. Patel M.D., M.S. Daniel Fields Elizabeth Leshen
The Primary Care Crisis, Page 2 The Promise of Health Reform
Comparison of Successful Medical Homes Dedicated Care Coordinator Access Data-driven tools Payment reform • Key common features are: • Dedicated care coordinators • Expanded access to care givers • Data-driven analytical tools • Incentives for providers Note: characteristics as reported * With care coordinator ** % reduction from baseline
Overview of Outcomes Hospitalization Reduction ED visit reduction Total savings / patient Colorado 18% $169-5303 • Pilots showed significant improvements: • Hospitalization reduction • ED visit reduction • Per-patient savings Geisinger Geisinger 15% 15% Group Health7 11% 29% $71 Intermountain Intermountain 4.8-19.2%5 4.8-19.2%5 0-7.3%8 0-7.3%8 $640 $640 North Carolina 40%2 16% $5166 North Dakota North Dakota North Dakota 6% 6% 24% 24% $530 $531 Vermont4 11% 12% $215 1 Not all metrics reported; unless indicated otherwise, data is based on as reported outcomes, reduction from baseline 2 Only for Asthma patients 3 $169 for all patients; $530 for patients with chronic conditions 4 Expected 5 4.8% for all patients; 19.2% for patients with complex illnesses 6 Based on AFDC savings from FY2007 ($135m) and ABD savings from FY2008 ($400m). 7 Change relative to control group. See Reid et al, 2009 for more detail. 8 No change for overall population, 7.3% for patients with complex illnesses. 1 Not all metrics reported; unless indicated otherwise, data is based on as reported outcomes, reduction from baseline 2 Only for Asthma patients 3 $169 for all patients; $530 for patients with chronic conditions 4 Expected 5 4.8% for all patients; 19.2% for patients with complex illnesses 6 Based on AFDC savings from FY2007 ($135m) and ABD savings from FY2008 ($400m). 7 Change relative to control group. See Reid et al, 2009 for more detail. 8 No change for overall population, 7.3% for patients with complex illnesses. Sources: Colorado Department of Health Care Policy and Financing, Geisinger Health Plan, Paulus et al., Group Health Cooperative, Reid et al (2009), Dorr et al (2006), Care Management Plus, Community Care of North Carolina, McCarthy et al (2008), Vermont Blueprint for Health 4
Challenges for the Future • Determining which features are essential and which can vary • Mastering the complexity of scalable implementation • Aggregating program data to learn from mistakes and successes • Consideration of systemic reforms? • Primary Care Pipeline- is it what we needed/wanted?