Stars
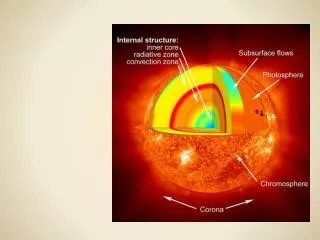
Stars. Dr Katy Lancaster. Overview. Introduction to stars What they are What we can measure The Hertzsprung-Russell Diagram Star life cycles Evolution of stars across the HR diagram. The Sun and all the stars we can see at night are part of the Milky Way galaxy.


Stars
E N D
Presentation Transcript
Stars Dr Katy Lancaster
Overview • Introduction to stars • What they are • What we can measure • The Hertzsprung-Russell Diagram • Star life cycles • Evolution of stars across the HR diagram
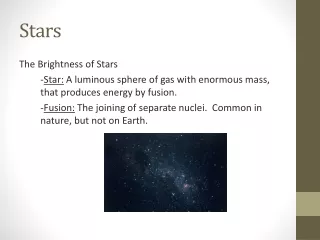
The Sun and all the stars we can see at night are part of the Milky Way galaxy It contains about 1011 stars, plus gas and dust between the stars (the intersellar medium) The Galaxy is basically disk shaped with a spheroidal bulge at the centre
Violation of this condition leads to the death of the star in that it will explode violently, scattering its constituent matter far and wide What is a Star? • In lay terms, a star is a big ball of burning gas • More technically, a star is a body which satisfies two conditions: • It is bound by self-gravity • Spherical due to the symmetric nature of gravity • It radiates energy from an internal source • Nuclear energy released by fusion reactions in its interior Violation of this condition (i.e. if the fuel source runs out) also leads to the death of the star in that it will simply fade away
ObservingStars • The information which we can gather from an individual star is quite restricted • ‘Apparent Brightness’ - amount of radiation falling per unit time per unit area (of detector) • This is the ‘radiation flux’, F. This is not an intrinsic property of the star since it depends on its distance from us
Stellar Luminosity • We measure the star’s flux, but the intrinsic property is the Luminosity • This is the amount of power radiated per unit time • Related to the measureable flux by: Inverse Square Law
Inverse Square Law Applies to radiation, gravitational and electric fields
Measuring Distances: Parallax • Observe ‘nearby’ star at the extremes of the earth’s orbit • Measure the difference in its apparent position relative to ‘distant’ background stars • Use trigonometry to deduce the distance of the nearby star
Using the Inverse Square Law • Measure distance to star (using parallax), measure flux luminosity • Star’s power output in Watts • Find other similar stars, assume luminosities are the same distances • Use particular types of star as ‘standard candles’ for determing distances to e.g. stellar clusters
Stellar Emission • Stars emit their radiation thermally (rather than via atomic transitions) • In physics, a ‘black body’ is an object that absorbs all radiation that falls upon it, thus appearing black in colour • Practically, black bodies also radiate (in order to retain their thermal equilibrium) • Stars are approximately black body emitters
Blackbody Temperatures • This plot is the intensity of the radiation vs wavelength • The peak intensity shifts to longer wavelengths as temperature decreases • We can use this to derive stellar temperatures
Finding temperatures from real observations • We could use a spectrometer to measure a star’s spectrum • Flux vs wavelength • From the shape, we can determine its temperature • Which stars are the hottest here? Which are the coldest?
Filters and colours • Alternatively, we can compare the star’s flux in two different wavebands • range of wavelengths, eg • This can be done more easily than taking a spectrum of the star • The bands are defined by standard filters • U (ultra-violet): 300-400nm • B (blue): 400-500nm • V (visual): 500-600nm
Filters No sharp cut-off
Colour Indices • Compare the ratio of the star’s flux in two filters, e.g. B and V, to find its ‘colour’ • Blackbody peak shifts to shorter wavelength as temperature increases • See more flux in the B (short )filter relative to the V filter (longer ) for a hot star • This means that we can deduce temperatures from these measurements • F(B)/F(V) large for hot stars • F(B)/F(V) small for cooler stars
Filters vs blackbody spectra Hot blue stars: Comparatively more flux in B filter Cool red stars: ratio is smaller
Spectral Classification • The Harvard classification system was developed in the 1890s by Annie Jump Cannon • Still in use today • The classes are based on features in the stars’ spectra…. • ….but actually it’s more useful to order the stars by their temperature or colour
Absorption Lines • The cooler outer regions of a star absorb photons from the hotter inner regions • Different elements absorb light at different frequencies • Atoms in different states absorb different frequencies
Titanium Oxide ‘Metals’ Helium lines
Stellar Classes • The spectral classes, ordered according to temperature: • O: > 25,000K • B: 11,000 - 25000K • A: 7,500 - 11,000K Sirius • F: 6,000 - 7,500K • G: 5,000 - 6,000K The Sun! • K: 3,500 - 5,000K • M: < 3,500K Betelguese
Very red (cool) Very blue (hot)
Luminosity vs Temperature • We have just seen how ‘colour’ (derived from flux) reflects temperature • There is also a correlation between luminosity (the intrinsic property) and temperature • If we plot the luminosities and temperatures of a large, representative sample of stars, we produce a ‘Hertzsprung-Russell’ diagram • Stars of the same type all lie in the same area of the HR diagram
80% of stars lie across this diagonal. This is the ‘Main sequence’
HR Diagram • About 80% of stars lie on a diagonal line across the plot • Main sequence • These are ‘dwarf’ stars • Giants lie above the main sequence • Sub-types populate separate areas • White dwarfs lie below the main sequence • This is the general case. Now let’s look as some specifics.
Open clusters • Found in disk of galaxy • E.g. the Pleiades • Contain 10 - 1000 stars • HR diagrams may contain less red giants • Predominantly young stars
Pleiades - HR diagram Few giants Predominantly main sequence stars
Globular Clusters • Found well away from galactic plane, in ‘halo’ of galaxy • E.g. M80 • Contain 105 - 106 stars • Blue end of main sequence not present • Many more red giants • Older stellar population
HR diagram for M80 Many giants No blue main sequence
HR Diagram Summary • The HR diagram is a plot of luminosity vs temperature for a population of stars • Stars of different types lie in different places on the HR diagram • 80% of stars lie on the Main Sequence • HR diagrams will look different for different stellar populations • Stars ‘evolve’ and move around the HR diagram. To understand this we need to study the life cycle of a star. • In practice we could: • classify a star from its spectrum, thus estimating its temperature • use the HR diagram to find its luminosity • compare its luminosity with its measured flux to derive its distance from us Or, for a star cluster at known distance: • Plot the luminosities and temperatures on an HR diagram • Deduce the cluster type, i.e. open or globular
Star Formation • In between the stars in a galaxy, there is a lot of gas which we call the interstellar medium (ISM) • The gas exists in clouds • Small clouds support themselves against gravity using their internal pressure • Large clouds( with masses greater than typical stellar masses) have gravity which exceeds the internal pressure, so are unstable to collapse • Clouds fragment, forming multiple stars and hence star clusters
Star Formation Regions Young stars Ionised gas Rosette Nebula
Protostars • The initial ‘free-fall’ phase of collapse is dominated by gravity • Gas still cool, radiates in the infra-red • As collapse progresses, internal pressure builds up, process slows • Star stars to heat up, makes transition to ‘pre-main sequence’
Main Sequence: Processes • For stars with masses at least 0.08 Msun • Central temperature reaches 107K, stars start burning Hydrogen (fusion) in their cores • Net effect: four protons turn into Helium nucleus: • This releases significant amounts of energy • The energy is transported to the star’s surface by radiation or convection
Main Sequence: Timescales • This process of turning Hydrogen into Helium is the energy source for main sequence stars • It takes around 1010 years for a star to deplete the Hydrogen in its core • The star then moves off the main sequence • Massive stars evolve off the main sequence more quickly
Aside: Smaller ‘Stars’ • Stars with masses less than 0.08 Msun never become hot enough to burn hydrogen • Smaller stars continue contracting, forming ‘brown dwarfs’ which are essentially failed stars • Jupiter is about 80 times less massive than a typical brown dwarf
Post Main Sequence • Hydrogen burning ceases and the core contracts, thus heating the star again • Helium now fusing in the core. Outside the core, a Hydrogen-burning shell forms • Star is now larger and cooler, but more luminous than before - Red Giant • When the Helium runs out, core collapses again, Carbon burning starts • This continues for all elements up to Iron • Evolution on HR diagram depends on mass
Shells of Fusion No elements heavier than Iron (Fe) can be created in this way
Star Death • Earlier, we defined stars as bodies which fulfill two criteria: • They are bound by self-gravity • They have an internal fuel source • Violation of either results in star death • The actual endpoint of a star is governed by its mass
Massive Stars • A massive star (10-60Msun) will complete all stages of fusion shown on the ‘shell’ diagram • The Iron core rapidly loses energy and contracts again, forming an extremely dense neutron star • This leaves the envelope (mainly Hydrogen and Helium) unsupported so it collapses • The rapid heating leads to a thermonuclear explosion - a Supernova • Supernovae produce the heavier elements
Supernovae • Supernovae are extremely luminous, with fluxes similar to those of entire galaxies • Most are seen in external galaxies (e.g SN1987a in the Large Magellanic Cloud) • We expect 1 SN every 30 years in our galaxy, but most are obscurred by interstellar dust • They leave behind a neutron star (which may be a pulsar), plus a remnant shell • These remnants may be observed for centuries afterwards
Neutron Stars and Pulsars • Neutron stars are tiny, but very dense • E.g. radius ~10km, mass 1.5Msun! • Hard to detect unless they are pulsars • Discovered in 1967 by Jocelyn Bell. Her PhD supervisor won the Nobel prize…. • Pulsars radiate beams from their magnetic poles (radio and optical) • These may sweep across the direction to the Earth as the star rotates • Incredibly accurate ‘clocks’
Supernova Remnant Pulsar! Crab nebula
Lower Mass Stars • Lower mass stars, such as the Sun, only form elements up to Helium via fusion • They undergo periods of instability while they evolve as giants • Eventually, pulsations in the star blow off the surface layers, revealing the hotter interior • The material which is blown off forms a ‘Planetary Nebula’ • The central star, made mostly of Carbon, cools and contracts to become a White Dwarf • They have high temperature but low luminosity