Download
1 / 28
280 likes | 411 Views
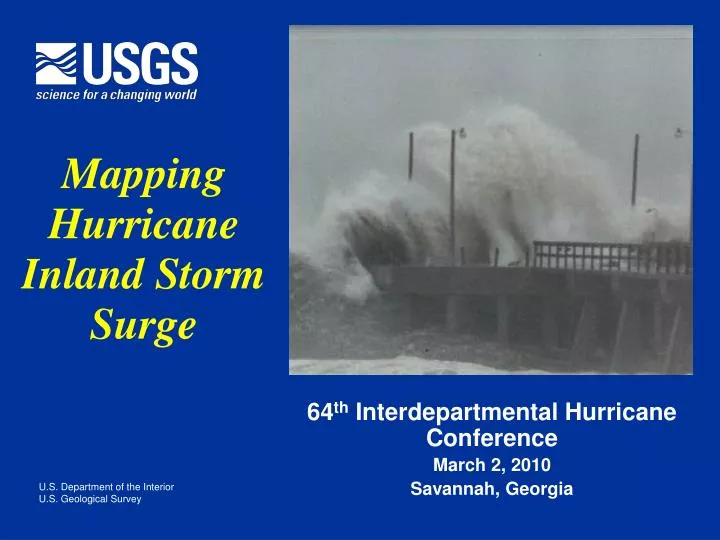
Mapping Hurricane Inland Storm Surge. 64 th Interdepartmental Hurricane Conference March 2, 2010 Savannah, Georgia. Where Do You Want to Go Today?. Intent of SSS Pilot Program History of SSS Pilot Program Roles & Responsibilities Designing a SSS Network Sensors & Housings

E N D
Mapping Hurricane Inland Storm Surge 64th Interdepartmental Hurricane Conference March 2, 2010 Savannah, Georgia
Where Do You Want to Go Today? • Intent of SSS Pilot Program • History of SSS Pilot Program • Roles & Responsibilities • Designing a SSS Network • Sensors & Housings • Timeline of Storm Event • Results
Intent of SSS Test Program A USGS program to monitor the areal extent and time hydrograph of hurricane storm surge for better documentation and modeling using rapid-deployment gages for the improvement of understanding of storm surge for better forecasting and response. Storm Surge Monitoring
Intent of SSS Test Program The data from this program is used to better calibrate storm surge models for more accurate surge forecasting caused by hurricanes. Traditional surge documentation was high water marks Previous to program, few continuous hydrographs of storm surge with very sparse coverage of any one event Storm Surge Monitoring
History of SSS Pilot Program Storm Surge Monitoring • Idea created by staff at Ruston, LA Program Office following Katrina (2005) • Quickly deployed for Rita (2005) in LA • Wilma (2005) in FL • Three SSS Centers created in 2006 (Ruston, Atlanta, and Orlando) • Ernesto (2006) in Carolinas • Limited deployment for Dean in South TX (2007) • Formalized by line item for 2008 USGS budget • Deployed for Gustav and Ike (2008) • No Gulf deployments in 2009 • Limited deployment (6) for T.S. Ida in Chesapeake Bay (2009) • No line item in 2010 • Maximum 1 small deployment in 2010
Roles and Responsibilities OSW • Project Oversight—OSW • Storm Surge Centers • Ruston, LA • Atlanta • Orlando • Water Science Centers • Focused on Gulf States, but Atlantic and Caribbean deployments possible Chain of Command Ruston Atlanta Orlando TX LA MS AL VA NC SC GA FL PR
Roles and Responsibilities Communication & Coordination Prior to start of season OSW & SSC planning period Prior to landfall Briefings from NHC & NWS Assign SSC primary lead & teams Assign WSC Communications lead Deploy sensors After landfall Sensor Recovery and processing Cooperator/media outreach Post-storm Surveying (if needed) Data Analysis and Reporting Prep for next storm Post-storm briefings to OFCM workgroup
SSS Network Design • Pre-determined sites • Selected from map and surge model analysis • Some may be pre-reconned • Some may have been deployed at previously • State and local agencies comments solicited • Need more input from OFAs (NOAA, Corps) • Starting to have “fixed” surge sites • Opportunistic sites • Location determined during pre-deployment meeting and during deployment • “On-the-fly” Types of Sites
SSS Network Design • Sensor location in water column • Expected surge height • Variability in Projected Storm Path • Datum Control • Barrier Islands • Accessibility • Proximity to Population Centers • Proximity to Existing Real-Time Gages • Quality-Assurance of SSS • Location of Barometric Pressure Sensors • Local WSC needs Site Selection Factors
Sensors and Housings Sensor Types • Onset HOBO pressure transducer (196 total) • Uses USB docking station to download data • Non-vented pressure transducer • 0-30 foot range • Internal battery must be factory replaced • Used for 30-second data intervals • Used as both BP and Surge sensors • Insitu TROLL pressure sensor (32 total, RT & salinity) • Non-vented pressure transducer • 0-35.8 foot range • SDI-12 • Used for 2-second data intervals (wave height)
Sensors and Housings Housing • Housing Pipe • Housing Cap • Sensor Eye Bolt • Ratchet Strap • USGS Visual Identity Sticker
High High water water - - mark mark H Results-Rita Time-Series Water-Level Hydrographs! http://pubs.usgs.gov/fs/2006/3136/
Surge/Velocity Progression up Calcasieu River Results-Rita http://pubs.usgs.gov/fs/2006/3136/
Wave Heights 1000 Feet From Beach Results-Rita http://pubs.usgs.gov/fs/2006/3136/
Storm Tide at 12:00 am Results-Rita http://pubs.usgs.gov/fs/2006/3136/
Storm Tide at 3:00 am Results-Rita http://pubs.usgs.gov/fs/2006/3136/
Storm Tide at 6:00 am Results-Rita http://pubs.usgs.gov/fs/2006/3136/
Storm Tide at 9:00 am Results-Rita http://pubs.usgs.gov/fs/2006/3136/
Results-Rita Maximum Storm Tide http://pubs.usgs.gov/fs/2006/3136/
Results-Rita Hurricane Rita 10-foot Flood Elevations http://pubs.usgs.gov/fs/2006/3136/
Results-Gustav Landfall September 1, 2008
Results-Gustav • 121 total sensors deployed • 61 water level • 49 barometric pressure • 10 were lost to storm • 21 sites had surge • 18 sites monitored riverine flooding • 5 sites were mixed/uncertain • 17 affected by gates/pumps • 8 feet approximate maximum surge recorded http://pubs.usgs.gov/of/2008/1373/
Results-Ike Landfall on September 12-13, 2008 http://pubs.usgs.gov/of/2008/1365/
Results-Ike • 105 total sensors deployed • 59 water level • 46 barometric pressure • 12 were lost to storm • 41 sites had surge • 10 sites monitored riverine flooding • 8 sites were beach/wave • 14-15 feet approximate maximum surge recorded http://pubs.usgs.gov/of/2008/1365/
Summary • Collaborations • Office of Federal Coordination for Meteorology—Post-storm data workgroup • National Hurricane Center • National Weather Service • Digital Hurricane Consortium (for complimentary wind data) • Universities: • LSU • OU • Notre Dame • Florida • Clemson • Need more input from modelers!!!
Summary • Program has been activated for 7 storms since 2005 • Standard Operations Plan in place for non-real-time sensor deployment • All information online at: • http://water.usgs.gov/osw/programs/storm_surge.html • Efforts have attracted numerous media including The Weather Channel and CNN • For 2010—smaller deployments (1 storm max) • Data are extremely valuable for modeling and understanding of storm surge—thus potentially benefitting from future prediction and response.
Questions? Brian McCallum (770) 903-9127 bemccall@usgs.gov