Download
1 / 10
120 likes | 396 Views
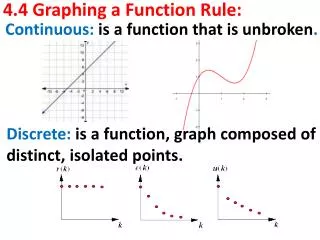
4.4 Graphing by Addition of Ordinates. The period of a sum function is found by examining the period of each individual part. The period is the first place the periods match up. For example, say 2 functions had periods of π and 2 π . What’s the period of the sum function?

E N D
The period of a sum function is found by examining the period of each individual part. The period is the first place the periods match up. For example, say 2 functions had periods of π and 2π. What’s the period of the sum function? list multiples of each until they match π 2π Something more challenging: Periods of 2π period = 2π period = π
Ex 1) Graph per = 2π per = π period = 2π Start by graphing (longer period) Check Period: b c a d = 1 = 0 = 2 = 0 2 Per = IL: –2
Ex 1) Graph Now graph on same axes Check Period: b c a d = 2 = 0 = 1 = 0 2 1 Per = IL: –1 –2 Continue graph to match cosine’s period
Ex 1) Graph Now add the 2 graphs together (y-values) At x = 0 2 + 0 = 2 At x = 1 + 1.4 = 2.4 At x = 0 + 0 = 0 At x = –1 + –1.4 = –2.4 At x = π 0 + –2 = –2 At x = 1 + –1.4 = –.4 At x = 0 + 0 = 0 3 2 1 –1 –2 –3
Let’s use Desmos to quickly graph the sum function and explore the period. Open Desmos. Choose , then Trigonometry , and then All the Trig Functions , then Explore this Graph! Tap into box 7 and delete boxes 4 – 7 add f (x) = to box 2 (use ) g (x) = to box 3
Ex 2) Find the period of Check it with Desmos. sin x: put in front of x cosx: put in front of x 12π 18π 12π 8π 12π turn both graphs on
In box 4, type f (x) + g (x) So confusing! The period should be 12π Turn off 2 & 3 Stretch y-axis to [–4, 4] Pinch x-axis until you can see the graph repeat itself At x = 0, y = 1 Does it = 1 again @ x = 12π? YEP!! turn it on
We don’t always just graph trig + trig, sometimes we graph trig + polynomial Ex 3) Graph y = sin x – x using ordinate addition (by hand from –2π to 2π) Confirm/ Check with Desmosf (x) = sin x g (x) = –x Try On Your Own keep f (x) + g (x) f (x) = sin x g (x) = –x f (x) + g (x) sin x– x
Homework #404 Pg 211 #9, 11, 12, 21, 22, 25, 29, 31, 34, 37, 38, 39, 40, 43, 49