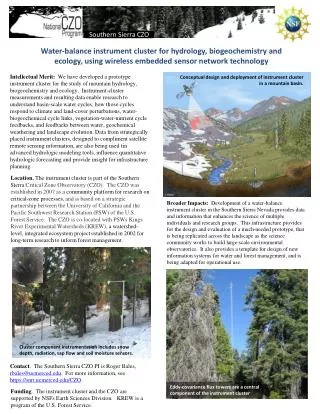
Download
1 / 17
170 likes | 281 Views
Satellite and Tower Data Reveal Unique Climate O ver the Southern Sierra Nevada. Eric Waller Department of Environmental Science, Policy, and Management University of California, Berkeley SSCZO Annual Meeting Fresno, CA 8/4/14. MODIS Aqua (~1 PM) April Cloud Frequency, 2003-2011.

E N D
Satellite and Tower Data Reveal Unique Climate Over the Southern Sierra Nevada Eric Waller Department of Environmental Science, Policy, and Management University of California, Berkeley SSCZO Annual Meeting Fresno, CA 8/4/14
MODIS Aqua (~1 PM) April Cloud Frequency, 2003-2011
Average MODIS (Aqua) 2012 Diel Land Surface Temperature Range (Day – Night) {Clear Sky Days!} Δ0C
Sequoia Points R2 = 0.58 Average Annual MODIS Cloud Frequency (%) Other Sierra Nevada Points Average Annual MODIS Diel Land Surface Temperature Range (C)
405 meters 2015 meters 1160 meters 2700 meters
Average ½ Hourly Temperature by Month: 2015 meter site January April Noon March February
Average ½ Hourly Dew Point Temperature by Month: 2015 meter site Afternoon peaks Noon
Average ½ Hourly Relative Humidity by Month: 2015 meter site Noon
Average ½ Hourly Relative Humidity by Month: 2015 m site, Clear Afternoons Noon
Average ½ Hourly Temperature for 4 Towers: April No daytime warm-up at tower at 2015 meters Noon
October minus April maximum temperature (California mountains unusually cold in April!) °C
Where’s this cold spring air coming from? -still cold North Pacific -Pacific high migrating north: winds/weather generally coming from northwest rather than the west (confirmed by NCEP/NARR data) -meridional flow: cutoff or closed lows
Regional and local conditions that favor Giant Sequoia: -Low wind -Frequent high afternoon humidity and cloud cover -Late spring shift in precipitation -Cold spring storms: late spring shift in snowfall A lot of these factors that could be beneficial to Sequoia could be reducing sublimation substantially as well. A need for better Sierra-wide mapping of sublimation?
This area also has among the lowest average wind speeds in the world. • Giant Sequoia is responding to some combination of these climatic features – basically outcompeting other species in this unique climate regime. • In sum: • Unusually cloudy, particularly on spring afternoons (strongest predictor of Giant Sequoia distribution) • But there are a lot of (cor)related variables: • Unusually low spring temperatures (April COLDER than January) • Low diel temperature range (so spring afternoons especially cool) • Afternoon peaks in water vapor • Highest relative humidity in the afternoon • Lowest vapor pressure deficit in the afternoon • Extremely low wind • Much of this unusual behavior only evident at height NOT PRE-DAWN!
Some extra factors to consider in assessing climates • Targeted climatic measurements above the surface • Daily patterns of temperature and humidity (rather than just min and max or average) • Extra measurements: wind, radiation (direct and diffuse), etc. • Relate to plant phyisological ecology and productivity