Download

1 / 5
50 likes | 131 Views
Fiscal Cliff and E conomic Indicators. By: Nolan Wurm Matthew Schweikart. Fiscal Cliff. Fiscal Cliff: 1. Will this help us or not?

E N D
Fiscal Cliff and Economic Indicators By: Nolan Wurm Matthew Schweikart
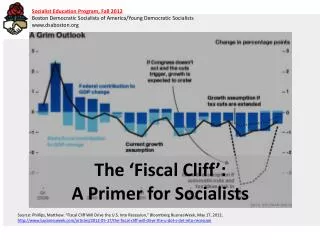
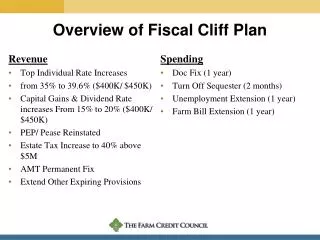
Fiscal Cliff Fiscal Cliff: • 1. Will this help us or not? A: This new plan for our country is to raise taxes by a small amount and lower the amount of taxes spent. This means that people will have to pay more in taxes but the government won’t spend as much so it will lower our debt • 2.Will it create expansion or recession? A: This will most likely create a recession because people will not have money to spend and the government won’t spend that money. • 3. How do you think it will affect the standard of living? A: This will most likely cause the standard of living to go down a little bit because people won’t have any extra money to spend. Therefore people won’t live as well because they can’t spend as much as they used to.
Economic Indicators What are the ten best economic indicators? • 1. Real GDP (Gross Domestic product) Importance: The Federal Reserve uses data such as the real GDP and other related economic indicators to adjust its monetary policy. • 2. M2 (money supply) Importance: The Federal Reserve uses this data to assess current economic and financial conditions, and to help alter its monetary policy, which includes raising and lowering interest rates. The Fed’s actions are aimed at bolstering or reducing the money supply. • 3.Consumer Price Index (CPI) Importance: This statistic is the best indicator of inflation that we have to rely on. It is particularly closely scrutinized by financial economists now since it shows inflation to be at a 16-year low. Changes in inflation can spur the Fed to take action to change its monetary policy. • 4. Producer Price Index( PPI) Importance: This index is timely because it is the first inflation measure available in the month. In addition, by watching crude prices, which are first in the pipeline, before it shows up in the CPI. • 5. Consumer Confidence Survey Importance: This statistic is a leading indicator of consumer spending-consumers are more inclined to spend money when they are feeling confident about their financial and employment prospects.
Economic Indicators continued… • 6. Current Employment Statistics(CES) • Importance: This is the earliest indicator of economic trends released each month. Employment rates indicate the well-being of the economy and labor force. Changes in wages point to earnings trends and related labor costs. Economists focus on the monthly change in total non-farm payrolls and in which sectors were gained or lost. • 7. Retail Trade Sales and food Services Sales • Importance: The numbers measure consumers' personal consumption across retail industries and track growth or deceleration of personal consumption spending, which makes up approximately two-thirds of the annual U.S. GDP. Analysts use the data to help track consumer spending trends and forecast the direction and magnitude of future spending. Automobile sales are separated from the data because of their volatility, which can sometimes obscure the underlying pattern of spending. • 8. Housing Starts( Formally known as “New Residential Construction) • Importance: The U.S. Department of Commerce's U.S. Census Bureau releases the data monthly, within two to three weeks after the end of the reporting month. • 9. Manufacturing and Trade Inventory and Sales • Importance: This data set is the primary source of information on the state of business inventories and business sales. Inventory rates often provide clues about the growth or contraction of the economy. A growth in business inventories may mean sales are slow and the economy's rate of growth is also slowing. If sales are slowing, businesses may be forced to cut production of goods, and that can eventually translate into inventory reductions. • 10. S&P 500 Stock Index (the S&P 500) • Importance: The index is designed to measure changes in the stock prices of component companies. It is used as a measure of the nation's stock of capital, as well as a gauge of future business and consumer confidence levels. Growth of the S&P 500 index can translate into growth of business investment. It can also be a clue to higher future consumer spending. A declining S&P 500 index can signal a tightening of belts for both businesses and consumers.
Consumer Price Index (CPI) – a measurement of changes in the price level of consumer goods and services purchased by households. This is a statistic and is only an estimate. Information gathered on: http://www.aaii.com/investing-basics/article/the-top-10-economic-indicators-what-to-watch-and-why • http://en.wikipedia.org/wiki/CPI