Download
1 / 60
600 likes | 713 Views
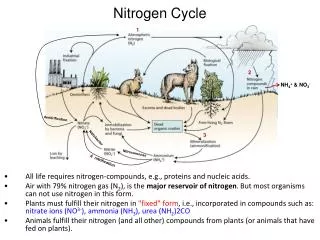
3. NITROGEN CYCLE. SOIL 5813 Soil-Plant Nutrient Cycling and Environmental Quality Department of Plant and Soil Sciences Oklahoma State University Stillwater, OK 74078 email: wrr@mail.pss.okstate.edu Tel: (405) 744-6414. GLOBAL WARMING. ATMOSPHERE. 3H 2 + N 2 2NH 3.

E N D
3. NITROGEN CYCLE SOIL 5813 Soil-Plant Nutrient Cycling and Environmental Quality Department of Plant and Soil Sciences Oklahoma State University Stillwater, OK 74078 email: wrr@mail.pss.okstate.edu Tel: (405) 744-6414
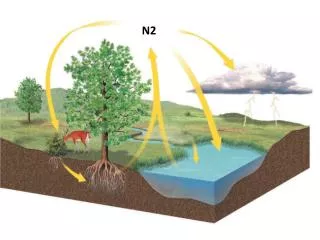
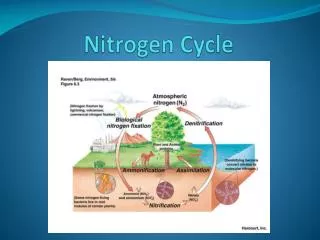
GLOBAL WARMING ATMOSPHERE 3H2 + N2 2NH3 N2O NO N2 INDUSTRIAL FIXATION LIGHTNING, RAINFALL N2 FIXATION PLANT AND ANIMAL RESIDUES HABER BOSCH SYMBIOTIC NON-SYMBIOTIC (1200°C, 500 atm) MESQUITE RHIZOBIUM ALFALFA SOYBEAN BLUE-GREEN ALGAE AZOTOBACTER CLOSTRIDIUM MATERIALS WITH N CONTENT > 1.5% (COW MANURE) MATERIALS WITH N CONTENT < 1.5% (WHEAT STRAW) FERTILIZATION PLANT LOSS AMINO ACIDS MICROBIAL DECOMPOSITION NH3 AMMONIA VOLATILIZATION IMMOBILIZATION AMINIZATION HETEROTROPHIC ORGANIC MATTER R-NH2 + ENERGY + CO2 BACTERIA (pH>6.0) FUNGI (pH<6.0) pH>7.0 R-NH2 + H2O AMMONIFICATION NH2OH IMMOBILIZATION R-OH + ENERGY + 2NH3 N2O2- Pseudomonas, Bacillus, Thiobacillus Denitrificans, and T. thioparus MICROBIAL/PLANT SINK 2NH4+ + 2OH- MINERALIZATION + NITRIFICATION FIXED ON EXCHANGE SITES +O2 NO2- Nitrosomonas DENITRIFICATION NO3- POOL NITRIFICATION 2NO2- + H2O + 4H+ OXIDATION STATES Nitrobacter + O2 DENITRIFICATION LEACHING LEACHING VOLATILIZATION NITRIFICATION ADDITIONS NH3 AMMONIA -3 NH4+ AMMONIUM -3 N2 DIATOMIC N 0 N2O NITROUS OXIDE 1 NO NITRIC OXIDE 2 NO2- NITRITE 3 NO3- NITRATE 5 Joanne LaRuffa Wade Thomason Shannon Taylor Heather Lees Department of Plant and Soil Sciences Oklahoma State University TEMP 50°F LEACHING LEACHING LOSSES OXIDATION REACTIONS LEACHING REDUCTION REACTIONS pH 7.0
Nitrogen cycle not well understood Temperature and pH included reduction/oxidation tillage (zero vs. conventional) C:N ratios (high, low lignin) Fertilizer source and a number of other variables. Mechanistic models would ultimately lead to many 'if-then' statements/decisions that could be used within a management strategy. >50°F <50°F Denitrification Volatilization Leaching Leaching 7.0soil pH
Assuming that we could speed up the nitrogen cycle what would you change? 1. Aerated environment (need for O2) 2. Supply of ammonium 3. Moisture 4. Temperature (30-35C or 86-95F) <10C or 50F 5. Soil pH 6. Addition of low C:N ratio materials (low lignin) Is oxygen required for nitrification? Does nitrification proceed during the growing cycle? (low C:N ratio) Plants remove O2 to incorporate N into amino forms amino NH NO NO 3 3 2 acids nitrate reductase nitrite reductase
N recommendations 1. Yield goal (2lb N/bu) a. Applies fertilization risk on the farmer b. Removes our inability to predict 'environment' (rainfall) 2. Soil test a. For every 1 ppm NO3, N recommendation reduced by 2lbN/ac 3. Potential yield Nitrite accumulation? 1. high pH 2. high NH4 levels (NH4 inhibits nitrobacter)
Inorganic Nitrogen Buffering Ability of the soil plant system to control the amount of inorganic N accumulation in the rooting profile when N fertilization rates exceed that required for maximum yield.
Soil-Plant Inorganic N Buffering Point where increasing applied N no longer increases grain yield 500 400 300 200 100 0 4000 3000 2000 1000 0 Soil Profile Inorganic N Accumulation, kg/ha Range (buffer) where increasing applied N does not increase grain yield, but also where no increase in soil profile inorganic N is observed Grain yield, kg/ha Point where increasing applied N increases soil profile inorganic N accumulation 0 40 80 120 160 200 240 Annual Nitrogen Fertilizer Rate, kg/ha
NH4, NO3 Fertilizer Organic Matter Pool Inorganic Nitrogen
30 100 200 300 400 0 30 60 60 90 90 120 150 120 180 150 N Rate kg ha-1 210 180 0 240 210 34 270 240 67 300 270 134 300 269 Udic Argiustoll, 0-240 cm, #502 Udic Argiustoll, 0-300 cm, #505 NO3--N, kg ha-1 NO3--N, kg ha-1 0 100 200 300 400 N Rate kg ha-1 0 Depth, cm Depth, cm 22 45 67 90 112
If the N rate required to detect soil profile NO3 accumulation always exceeded that required for maximum yields, what biological mechanisms are present that cause excess N applied to be lost via other pathways prior to leaching? Nitrogen Buffering Mechanisms 1. Increased Applied N results in increased plant N loss (NH3)
Lees, H.L., W.R. Raun and G.V. Johnson. 2000. Increased plant N loss with increasing nitrogen applied in winter wheat observed with 15N. J. Plant Nutr. 23:219-230.
Bidwell (1979), Plant Physiology, 2nd Ed. Metabolism associated with nitrate reduction photosynthesis carbohydrates respiration reducing power carbon skeletons NADH or NADPH amino NH NO NO 3 3 2 acids nitrate nitrite reductase reductase ferredoxin siroheme Francis, D.D., J.S. Schepers, and M.F. Vigil. 1993. Post-anthesis nitrogen loss from corn. Agron. J. 85:659-663.
Nitrogen Buffering Mechanisms 1. Increased Applied N results in increased plant N loss (NH3) 2. Higher rates of applied N - increased volatilization losses
Nitrogen Buffering Mechanisms 1. Increased Applied N results in increased plant N loss (NH3) 2. Higher rates of applied N - increased volatilization losses 3. Higher rates of applied N - increased denitrification Burford and Bremner (1975) found that denitrification losses increased under anaerobic conditions with increasing organic C in surface soils (0-15 cm) (wide range in pH & texture). Denitrifying bacteria responsible for reduction of nitrate to gaseous forms of nitrogen are facultative anaerobes that have the ability to use both oxygen and nitrate (or nitrite) as hydrogen acceptors. If an oxidizable substrate is present, they can grow under anaerobic conditions in the presence of nitrate or under aerobic conditions in the presence of any suitable source of nitrogen
Nitrogen Buffering Mechanisms 1. Increased Applied N results in increased plant N loss (NH3) 2. Higher rates of applied N - increased volatilization losses 3. Higher rates of applied N - increased denitrification 4. Higher rates of applied N - increased organic C, - increased organic N
#406 0.1 0.9 0.09 0.8 0.08 0.7 Total Soil N, % 0.07 Organic Carbon, % 0.6 0.06 TSN SED TSN = 0.002 0.5 0.05 SED OC = 0.03 OC 0.04 0.4 0 40 80 120 160 200 N Rate, kg/ha Raun, W.R., G.V. Johnson, S.B. Phillips and R.L. Westerman. 1998. Effect of long-term nitrogen fertilization on soil organic C and total N in continuous wheat under conventional tillage in Oklahoma. Soil & Tillage Res. 47:323-330.
Nitrogen Buffering Mechanisms 1. Increased Applied N results in increased plant N loss (NH3) 2. Higher rates of applied N - increased volatilization losses 3. Higher rates of applied N - increased denitrification 4. Higher rates of applied N - increased organic C, - increased organic N 5. Increased applied N - increased grain protein
Increased grain N uptake (protein) at N rates in excess of that required for maximum yield Point where increasing applied N no longer increases grain yield 80 60 40 20 0 Continued increase in grain N uptake, beyond the point where increasing applied N increases soil profile inorganic N accumulation Grain N uptake, kg/ha 0 40 80 120 160 200 240 Annual Nitrogen Fertilizer Rate, kg/ha
# 222 80 Y = 29.7 + 0.28x - 0.00055x2 70 r2=0.90 9.4 =19% 60 50 Grain N Uptake, kg/ha 40 30 20 0 20 40 60 80 100 120 140 N rate, kg/ha
Nitrogen Buffering Mechanisms 1. Increased Applied N results in increased plant N loss (NH3) 2. Higher rates of applied N - increased volatilization losses 3. Higher rates of applied N - increased denitrification 4. Higher rates of applied N - increased organic C, - increased organic N 5. Increased applied N - increased grain protein 6. Increased applied N - increased forage N 7. Increased applied N - increased straw N
1 Mills et al., 1974 Matocha, 1976 DuPlessis and Kroontje, 1964 Terman, 1979 Sharpe et al., 1988 N Buffering Mechanisms 1 4 0-50 kg N/ha/yr 15-40 kg N/ha/yr NH3 NH4+OH- NH3 + H2O Fertilizer N NO Volatilization N2O Urea Applied N2 3 NH4 fixation (physical) Denitrification 7-80 kg N/ha/yr NH3, N2 10-50 kg N/ha/yr 2 Microbial Pool Organic Immobilization NH4 NO3 NO2 5 Chaney, 1989 Sommerfeldt and Smith, 1973 Macdonald et al., 1989 Kladivko, 1991 NO3 5 Leaching 2 3 4 0-20 kg N/ha/yr Olson and Swallow, 1984 Sharpe et al., 1988 Timmons and Cruse, 1990 Francis et al., 1993 Hooker et al., 1980 O’Deen, 1986, 1989 Daigger et al., 1976 Parton et al., 1988 Aulackh et al., 1984 Colbourn et al., 1984 Bakken et al., 1987 Prade and Trolldenier, 1990
NITROGEN Cycle Links Industrial view of the Nitrogen CycleNutrient Overload: Unbalancing the Global Nitrogen Cycle Carbon Cycle
Urea • Urea is the most important solid fertilizer in the world today. • In the early 1960's, ammonium sulfate was the primary N product in world trade (Bock and Kissel, 1988). • The majority of all urea production in the U.S. takes place in Louisiana, Alaska and Oklahoma. • Since 1968, direct application of anhydrous ammonia has ranged from 37 to 40% of total N use (Bock and Kissel, 1988) • Urea: high analysis, safety, economy of production, transport and distribution make it a leader in world N trade. • In 1978, developed countries accounted for 44% of the world N market (Bock and Kissel, 1988). • By 1987, developed countries accounted for less than 33%
Koch Industries 7.5 million metric tons of N fertilizer/year World Total Production N, P, and K 216 million metric tons
Share of world N consumption by product group • 1970 1986 2004 • Ammonium sulfate 8 5 2 • Ammonium nitrate 27 15 14 Urea 9 37 50 • Ammonium phosphates 1 5Other N products (NH3) 36 29 30Other complex N products 16 8 • Urea Hydrolysis • increase pH (less H+ ions in soil solution) urease enzyme required • CO(NH2)2 + H+ + 2H2O --------> 2NH4+ + HCO3- • pH 6.5 to 8 • HCO3- + H+ ---> CO2 + H2O (added H lost from soil solution) • CO(NH2)2 + 2H+ + 2H2O --------> 2NH4+ + H2CO3 (carbonic acid) • pH <6.3 • H2CO3 CO2 + H2O
During hydrolysis, soil pH can increase to >7 because the reaction requires H+ from the soil system. • (How many moles of H+ are consumed for each mole of urea hydrolyzed?) 2 • In alkaline soils less H+ is initially needed to drive urea hydrolysis on a soil already having low H+. • In an alkaline soil, removing more H+(from a soil solution already low in H+), can increase pH even higher • NH4+ + OH- ---> NH4OH ---->NH3 + H2O • pH = -log[H+] • Calculate pH of 2.0x10⁻³M solution of HCl • HCl is completely ionized so • [H+] = 2.0 x 10⁻³M • pH = -log(2.0x10⁻³) • = 3 – log 2.0 • = 3 - 0.30 • = 2.70
pH = pKa + log [(base)/(acid)] • pKw = pH + pOH • 14.00 = pH + pOH • At a pH of 9.3 (pKa 9.3) 50% NH4 and 50% NH3 • pH Base (NH3) Acid (NH4) • 7.3 1 99 • 8.3 10 90 • 9.3 50 50 • 10.3 90 10 • 11.3 99 1 Chemicals A and B react to form C and D A + B = C + D Equilibrium Constant (K) K = [C][D] / [A][B]
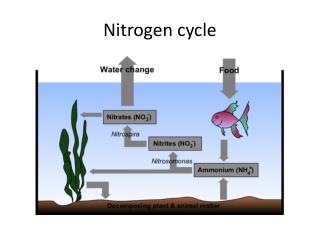
H20 H+ + OH- Equilibrium relationship for ammoniacal N and resultant amount of NH3 and NH4 as affected by pH for a dilute solution.
As the pH increases from urea hydrolysis, negative charges become available for NH4+ adsorption because of the release of H+ (Koelliker and Kissel) • Decrease NH3 loss with increasing CEC (Fenn and Kissel, 1976) • Assuming that pH and CEC are positively correlated, what is happening? • Relationship of pH and BI (?) none • In acid soils, the exchange of NH4+ is for H+ on the exchange complex (release of H here, resists change in pH, e.g. going up) • In alkaline soils with high CEC, NH4 exchanges for Ca, precipitation of CaCO3 (CO3= from HCO3- above) and one H+ released which helps resist the increase in pH • However, pH was already high, ** on soils where organic matter dominates the contribution to CEC then there should be a positive relationship of pH and CEC. CEC pH
N Rate = 112 kg/ha Soil surface pH and cumulative NH3 loss as influenced by pH buffering capacity (from Ferguson et al., 1984).
Ernst and Massey (1960) found increased NH3 volatilization when liming a silt loam soil. The effective CEC would have been increased by liming but the rise in soil pH decreased the soils ability to supply H+ • Rapid urea hydrolysis: greater potential for NH3 loss. Why? • Management: • dry soil surface • Incorporate • localized placement- slows urea hydrolysis
H ion buffering capacity of the soil: • Ferguson et al., 1984 • (soils total acidity, comprised of exchangeable acidity + nonexchangeable titratable acidity) • A large component of a soils total acidity is that associated with the layer silicate sesquioxide complex (Al and Fe hydrous oxides). These sesquioxides carry a net positive charge and can hydrolyze to form H+ which resist an increase in pH upon an addition of a base. • H+ ion supply comes from: • 1. OM • 2. hydrolysis of water • 3. Al and Fe hydrous oxides • 4. high clay content (especially 2:1, reason CEC’s are higher in non-weathered clays is due to isomorphic substitution – pH independent charge)
Soil with an increased H+ buffering capacity will also show less NH3 loss when urea is applied without incorporation. • 1. hydroxy Al-polymers added (carrying a net positive charge) to increase H+ buffering capacity. • 2. strong acid cation exchange resins added (buffering capacity changed without affecting CEC, e.g. resin was saturated with H+). • resin: amorphous organic substances (plant secretions), soluble in organic solvents but not in water (used in plastics, inks) • Consider the following • 1. H+ is required for urea hydrolysis2. Ability of a soil to supply H+ is related to amount of NH3 loss3. H+ is produced via nitrification (after urea is applied): acidity generated is not beneficial4. What could we apply with the urea to reduce NH3 loss?
an acid; strong electrolyte; dissociates to produce H+;increased H+ buffering; decrease pH • reduce NH3 loss by maintaining a low pH in the vicinity of the fertilizer granule (e.g. H3PO4) • Comment: Ferguson et al. (1984). • “When urea is applied to the soil surface, NH3 volatilization probably will not be economically serious unless the soil surface pH rises above 7.5”
UREASE inhibitors “Agrotain” n-butyl thiophosphoric triamide http://www.agrotain.com Nitrosomonas inhibitors “NSERVE” 2-CHLORO-6-(TRICHLOROMETHYL) PYRIDINE http://jeq.scijournals.org/cgi/content/abstract/32/5/1764
NEED for INCREASED NUE Computation/commodity Production, mT World consumption of fertilizer-N 90,000,000 Fert-N used in cereals (60% of total applied) 0.60 * 82,906,340 = 54,000,000 World Cereal Production, mT Rye 1% Oats Sorghum Millet 2% 3% 1% Wheat Barley 28% 8% Rice 28% Corn 29%
World grain N removal, 1996 %N mTWheat 2.13 12,502,267 Corn 1.26 7,439,266 Rice 1.23 7,007,101 Barley 2.02 3,154,192 Sorghum 1.92 1,356,807 Millet 2.01 580,032 Oats 1.93 596,012 Rye 2.21 508,788 Total N removed in cereals 33,144,465 N removed in cereals (from soil & rain, 50% of total) 16,572,232 NUE = ((N removed - N soil&rain)/total N applied) 33% Savings/yr for each 1% increase in NUE 489,892 mT Value of fertilizer savings $479/mT N $234,658,462 2005 >$400,000,000
____________________________________ • World cereal grain NUE 33% • Developed nation cereal NUE 42% • Developing nation cereal NUE 29% ____________________________________ • 1% increase in worldwide cereal NUE = $234,658,462 fertilizer savings • 20% increase in worldwide cereal NUE 1999 = $4.7 billion 2005, > 10 billion
Flowchart for NUE http://www.nue.okstate.edu/NUE_etc.htm
Role of NH4 nutrition in Higher Yields (S.R. Olsen) • Glutamine-major product formed in roots absorbing NH4 • NO3 has to be transported to the leaves to be reduced • Wheat N uptake was increased 35% when supplying 25% of the N as NH4 compared to all N as NO3 (Wang and Below, 1992). • High-yielding corn genotypes were unable to absorb NO3 during ear development, thus limiting yields otherwise increased by supplies of NH4 (Pan et al., 1984). • Assimilation of NO3 requires the energy equivalent of 20 ATP/moleNO3, whereas NH4 assimilation requires only 5 ATP/mole NH4 (Salsac et al., 1987). • This energy savings may lead to greater dry weight production for plants supplied solely with NH4 (Huffman, 1989).
Bidwell (1979), Plant Physiology, 2nd Ed. Metabolism associated with nitrate reduction photosynthesis carbohydrates respiration reducing power carbon skeletons NADH or NADPH amino NH NO NO 3 3 2 acids nitrate nitrite reductase reductase ferredoxin siroheme
Discussion: Global Population and the Nitrogen Cycle p.80 nitrous oxide Increasing use of fertilizer N results in increased N2O. Reaction of nitrous oxide (N2O) with Oxygen contribute to the destruction of ozone. Atmospheric lifetime of nitrous oxide is longer than a century, and every one of its molecules absorbs roughly 200 times more outgoing radiation than does a single carbon dioxide molecule. “In just one lifetime, humanity has indeed developed a profound chemical dependence.”
Factors Affecting Soil Acidity • Acid: substance that tends to give up protons (H+) to some other substance • Base: accepts protonsAnion: negatively charged ionCation: positively charged ion • Base cation: ? (this has been taught in the past but is not correct) • Electrolyte: nonmetallic electric conductor in which current is carried by the movement of ions • H2SO4 (strong electrolyte) • CH3COOH (weak electrolyte) • H2O • HA --------------> H+ + A- • potential active • acidity acidity
1. Nitrogen Fertilization • A. ammoniacal sources of N • 2. Decomposition of organic matter • OM ------> R-NH2 + CO2 • CO2 + H2O --------> H2CO3 (carbonic acid) • H2CO3 ------> H+ + HCO3- (bicarbonate) • humus contains reactive carboxylic, phenolic groups that behave as weak acids which dissociate and release H+
3. Leaching of exchangeable bases/Removal • Ca, Mg, K and Na (out of the effective root zone) • -problem in sandy soils with low CEC • a. Replaced first by H and subsequently by Al (Al is one of the most abundant elements in soils. 7.1% by weight of earth's crust) • b. Al displaced from clay minerals, hydrolyzed to hydroxy aluminum complexes • c. Hydrolysis of monomeric forms liberate H+ • d. Al(H2O)6+3 + H2O -----> Al(OH)(H2O)++ + H2O+ • monomeric: a chemical compound that can undergo polymerization • polymerization: a chemical reaction in which two or more small molecules combine to form larger molecules that contain repeating structural units of the original molecules
4. Aluminosilicate clays • Presence of exchangeable Al • Al+3 + H2O -----> AlOH= + H+ • 5. Acid Rain
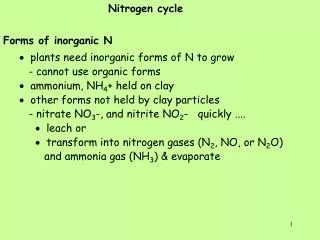
NITROGEN: Key building block of protein molecule Component of the protoplasm of plants animals and microorganisms One of few soil nutrients lost by volatilization and leaching, thus requiring continued conservation and maintenance Most frequently deficient nutrient in crop production Nitrogen Ion/Molecule Oxidation States Range of N oxidation states from -3 to +5. oxidized: loses electrons, takes on a positive charge reduced: gains electrons, takes on a negative charge Illustrate oxidation states using common combinations of N with H and O H can be assumed in the +1 oxidation state (H+1) O in the -2 oxidation state (O=)