Download
1 / 35
350 likes | 553 Views
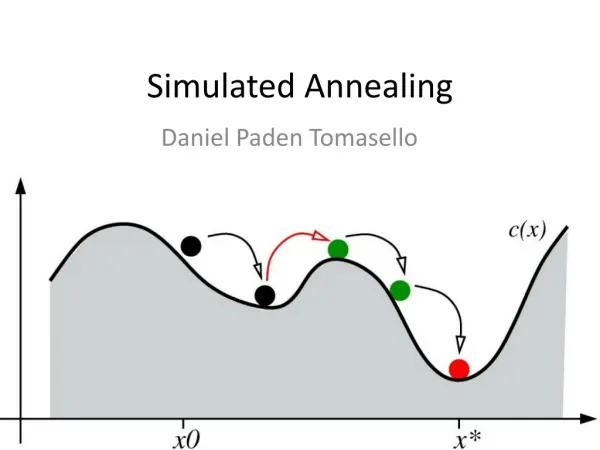
Using Simulated Annealing and Evolution Strategy scheduling capital products with complex product structure. By: Dongping SONG Supervisors: Dr. Chris Hicks and Prof. Chris F. Earl Department of MMM Engineering University of Newcastle, Oct., 2000. Contents. Introduction

E N D
Using Simulated Annealing and Evolution Strategy schedulingcapital products with complex product structure By: Dongping SONG Supervisors: Dr. Chris Hicks and Prof. Chris F. Earl Department of MMM Engineering University of Newcastle, Oct., 2000.
Contents • Introduction • Problem formulation • A discrete event-driven model • Simulated Annealing • Evolution Strategy • Case studies • Conclusions
Introduction Production scheduling -- the allocation of resources over time to perform a collection of tasks (Baker, 1974). Two important points in scheduling: Sequencing -- in which order to perform tasks on resources Timing -- when to start and complete tasks
Introduction • The importance of sequencing has been well recognised, because • the optimal schedule can only be characterised by the sequences for performance measures such as mean flow-time, percentage of jobs tardy, mean tardiness, etc. • However, timing scheduling is necessary • for performance measures such as earliness and tardiness costs, total discrepancy from the due dates, etc.
Introduction - effect of timing Example 1. One machine with three independent jobs. Due dates Schedule A: Schedule B: Schedule C:
Introduction - effect of timing Example 2. Two machines four jobs s.t. job 1 becomes job 4 and job 2 becomes job 3 after completion. Schedule A: Schedule B:
Introduction - a capital product Complex product structure
product Waiting time Time period Gantt chart -- with 113 operations (13 assemblies).
Work-load Machine Time period Resource chart -- work-load on 13 machines.
Introduction • Constraints in our scheduling problem: • Operation precedence constraints • Resource capacity constraints • Due date constraints • Assembly co-ordination requirements • Scheduling problem: to find optimal operation sequences and timings to meet above constraints and minimise total cost.
Problem formulation • Notation: si -- planned start time for operation i;N -- total operation number. • Solution space of schedules := RN´{sequences on resources}. • Solution space can be simplified to RN, because operations on the same resource have different start times (i.e. timings imply sequences).
Problem formulation • The schedule problem can be formulated as a numerical optimisation problem. • Find the optimal {si, i=1,..,N} to minimise the total cost J(s) = å (Work-in-progress holding costs + product earliness costs + product tardiness costs)
Problem formulation • Questions: (1) How to execute a schedule that is characterised by {si} ? (2) How to evaluate the cost function for a given schedule ?
Discrete event-driven model • Two types of events : • the start of an operation • the completion of an operation. • Two constraints to trigger the start events : • Physical constraints : an event cannot occur before all preceding events are completed. • Planning constraints : an operation cannot be started before its planned start time si.
Discrete event-driven model The evolution of the system for a given schedule {si} can be described by: • If a resource is idle, an operation will be processed as soon as the physical and planning constraints are satisfied. • If there is a queue of operations ready for processing, the operation with the earliest siwill be processed first.
Simulated Annealing • Neighbourhood of a solution -- by adding a random number to each si. • Outer loop -- cooling the temperature T until T=0. • Inner loop -- perform Metropolis simulation with fixed T to find equilibrium state.
Simulated Annealing • Adjust the solution : • shift the whole schedule (optional) • impose precedence constraints (optional) • make non-negative • Evaluate cost function : • run the DED model
Evolution Strategy • Similarity of Genetic Algorithms and ES: • model organic evolution. • iterative scheme including “selection”, “crossover” and “mutation”. • Difference of GA and ES: • GA uses binary or string representations, suitable for combinatorial optimisation problem. • ES uses continuous variable, suitable for numerical optimisation problem.
Evolution Strategy • Crossover -- randomly copy elements from parents column by column.
Evolution Strategy • Mutation -- add a random number from a Normal distribution to each element.
Evolution Strategy • Adjust the solution : • shift the whole schedule (optional) • impose precedence constraints (optional) • make non-negative • Evaluate cost function -- run the DED model. • Selection -- choose a set of best offspring as parents for the next generation
Case studies Characteristics of scheduling problems
Case study 1 MRP -- material requirement planning FIFO -- first in first out EDD -- earliest due date first SPT -- shortest processing time first Cost is reduced by 50% for SA and ES.
Case study 1 -- cost v.s cpu Cost SA ES CPU(s) Total cost v.s. CPU time for SA and ES
Case study 1 -- ES method Cost Maximum cost at each generation Maximum cost in all parents CPU(s) Minimum cost at each generation
Case study 2 Cost is reduced by 50% for SA and ES.
Case study 2 -- cost v.s. cpu Cost SA ES CPU(s) Total cost v.s CPU time for SA and ES
Case study 2 -- ES method Cost Maximum cost at each generation Maximum cost in all parents CPU(s) Minimum cost at each generation
Conclusions • SA and ES can reduce total cost by 50% compared with MRP+dispatching rules. • ES is generally better than SA in both cost and CPU time. • ES is more robust to its initial parameter selection than SA.
Conclusions • Suggestions for SA initial parameters: • T0 and step-size is taken from [d/N, 20*d/N]; • Temperature cooling rate > 0.5 and step-size reduction factors > 0.70; • No-improvement number at inner loop > N/2; • Suggestions for ES initial parameters: • Offspring population is from [N/2, 2*N]; • Parent population is 1/10 to 1/5 of offspring; • Initial standard deviation is from [d/N, 5*d/N].
Further work • Compare our methods with GA (Pongcharoen, et al.) for the same cost function. • Develop hybrid optimisation methods by combining SA, ES with Perturbation Analysis or heuristics. • Extend to stochastic situations such as dynamic customer demand arrivals and processing uncertainties.
SA -- effect of parameters T0=1 T0=40 T0=20 T0=10 Initial temperature and temperature cooling factor
ES -- effect of parameters Solid-line : ON/GN=80/250 dashed-line: ON/GN=100/400 dotted-line: ON/GN=160/250 dash-dotted: ON/GN=200/200 Offspring Number(ON)/Generation Number(GN) and Standard deviation reduction factor