Download
1 / 66
660 likes | 781 Views
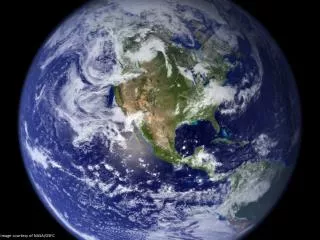
Image courtesy of NASA/GSFC. Climate Change and Plant Stress. Eugene S. Takle Professor Department of Agronomy Department of Geological and Atmospheric Science Director, Climate Science Program Iowa State University Ames, IA 50011. Center for Plant Stress Iowa State University

E N D
Climate Change and Plant Stress Eugene S. Takle Professor Department of Agronomy Department of Geological and Atmospheric Science Director, Climate Science Program Iowa State University Ames, IA 50011 Center for Plant Stress Iowa State University 5 October 2012
Outline • Scientific evidence for global climate change • Projected changes in US climate • Changes of importance to agricultural plants • Recent trends in Iowa’s climate and producer adaptation • What about the future: droughts or floods?
Natural factors affect climate Variations in the energy received from the sun Variations in the Earth's orbit (Milankovic effect) Stratospheric aerosols from energetic volcanic eruptions Chaotic interactions in the Earth's climate (for example, El Nino, NAO) Don Wuebbles
Non-natural mechanisms • Changes in atmospheric concentrations ofradiatively important gases • Changes in aerosol particles from burning fossil fuels and biomass • Changes in the reflectivity (albedo) of the Earth’s surface Don Wuebbles
Warming of the Lower and Upper Atmosphere Produced by Natural and Human Causes Karl, T. R., J. M. Melillo, and T. C. Peterson, (eds.), 2009: Global Climate Change Impacts in the United States. Cambridge University Press, 2009, 196pp.
Warming of the Lower and Upper Atmosphere Produced by Natural and Human Causes Note that greenhouse gases have a unique temperature signature, with strong warming in the upper troposphere, cooling in the lower stratosphere and strong warming at the surface over the North Pole. No other warming factors have this signature. Karl, T. R., J. M. Melillo, and T. C. Peterson, (eds.), 2009: Global Climate Change Impacts in the United States. Cambridge University Press, 2009, 196pp.
Warming of the Lower and Upper Atmosphere Produced by Natural and Human Causes Note that greenhouse gases have a unique temperature signature, with strong warming in the upper troposphere, cooling in the lower stratosphere and strong warming at the surface over the North Pole. No other warming factors have this signature. Karl, T. R., J. M. Melillo, and T. C. Peterson, (eds.), 2009: Global Climate Change Impacts in the United States. Cambridge University Press, 2009, 196pp.
Warming of the Lower and Upper Atmosphere Produced by Natural and Human Causes Note that greenhouse gases have a unique temperature signature, with strong warming in the upper troposphere, cooling in the lower stratosphere and strong warming at the surface over the North Pole. No other warming factors have this signature.
Three separate analyses of the temperature record – Trends are in close agreement 2010 2011 2010 tied 2005 as the warmest year on record since 1880
Conditions today are unusual in the context of the last 2,000 years … Don Wuebbles
Climate models: Natural processes do not account for observed 20th century warming after 1965 Don Wuebbles
We have Moved Outside the Range of Historical Variation 800,000 Year Record of Carbon Dioxide Concentration Don Wuebbles
What can we expect in the future? Don Wuebbles
December-January-February Temperature Change 7.2oF 6.3oF A1B Emission Scenario 2080-2099 minus1980-1999
June-July-August Temperature Change 4.5oF 5.4oF A1B Emission Scenario 2080-2099 minus1980-1999
Increases in very high temperatures will have wide-ranging effects Higher Emissions Scenario, 2080-2099 Number of Days Over 100ºF Average: 30-60 days Recent Past, 1961-1979 Lower Emissions Scenario, 2080-2099 Average: 10-20 days Don Wuebbles
Increases in very high temperatures will have wide-ranging effects Higher Emissions Scenario, 2080-2099 Number of Days Over 100ºF Average: 30-60 days Recent Past, 1961-1979 Current Des Moines average is < 1.4 days per year over 100oF Lower Emissions Scenario, 2080-2099 Average: 10-20 days Don Wuebbles
Projected Change in Precipitation: 2081-2099 Midwest: Increasing winter and spring precipitation, with drier summers More frequent and intense periods of heavy rainfall Unstippled regions indicate reduced confidence Relative to 1960-1990 NOTE: Scale Reversed
Extreme weather events become more common • Events now considered rare will become commonplace. • Heat waves will likely become longer and more severe • Droughts are likely to become more frequent and severe in some regions • Likely increase in severe thunderstorms (and perhaps in tornadoes). • Winter storm tracks are shifting northward and the strongest storms are likely to become stronger and more frequent. Don Wuebbles
Key Messages from The 2008 USGCRP Synthesis and Assessment Product 4.3 (now being updated by the National Climate Assessment)
Key Messages from the 2008 USGCRP SAP 4.3 • Climate changes – temperature increases, increasing CO2 levels, and altered patterns of precipitation – are already affecting U.S. water resources, agriculture, land resources, and biodiversity • Climate change will continue to have significant effects on these resources over the next few decades and beyond • With increased CO2 and temperature, the life cycle of grain and oilseed crops will likely progress more rapidly. But, as temperature rises, these crops will increasingly begin to experience failure, especially if climate variability increases and precipitation lessens or becomes more variable. • The marketable yield of many horticultural crops – e.g., tomatoes, onions, fruits – is very likely to be more sensitive to climate change than grain and oilseed crops.
Key Messages from the 2008 USGCRP SAP 4.3 • Climate change is likely to lead to a northward migration of weeds. Many weeds respond more positively to increasing CO2 than most cash crops, particularly C3 “invasive” weeds. Recent research also suggests that glyphosate, the most widely used herbicide in the United States, loses its efficacy on weeds grown at the increased CO2 levels likely in the coming decades. • Disease pressure on crops will likely increase with earlier springs and warmer winters, which will allow proliferation and higher survival rates of pathogens and parasites. Regional variation in warming and changes in rainfall will also affect spatial and temporal distribution of disease. • Projected increases in temperature and a lengthening of the growing season will likely extend forage production into late fall and early spring, thereby decreasing need for winter season forage reserves. However, these benefits will very likely be affected by regional variations in water availability. • Climate change-induced shifts in plant species are already under way in rangelands. Establishment of perennial herbaceous species is reducing soil water availability early in the growing season.
Crop Yield and Grain Quality are Compromised by Temperature Increase Days/Yr with T>100oF Rising daily maximum temperatures increase the likelihood of extended periods with temperatures above the failure point for reproduction (grain production) Rising nighttime temperatures (oF) decrease the quality of grain (corn)
Percent Changes in Crop Yield with Projected Changes in Annual Mean Temperature (not water or nutrient limited) California Central Valley Lee, J., S. DeGryze, and J. Six. 2011. Effect of climate change on field crop production in the California’s Central Valley. Climatic Change. 109(Suppl):S335-S353
Projected Yield Changes for California Crops Simulations using the DAYCENT model while ensuring water supplies and nutrients were maintained at adequate levels under low (B1) and medium-high (A2) emissions scenarios. Lee, J., S. DeGryze, and J. Six. 2011. Effect of climate change on field crop production in the California’s Central Valley. Climatic Change. 109(Suppl):S335-S353
Changes in Climate Relevant to Plant Stress A2 Climate scenario Chilling hours for fruit production Number of chilling hours is projected to rapidly decrease over the next 100 years. Trees and grapes differ in their chilling requirements: grapes: 90 peaches 225 apples 400 cherries 900
Can we trust climate models to project a future climate in the Midwest? • NASA GISS model from 1988 projected for Iowa: • Longer growing season • Winters will warm more than summers • Nights will warm more than days • Precipitation will increase • Shift in precipitation seasonality toward more in the first half year and less in the second half After 21 years how well have they done? Takle, E. S., and S. Zhong, 1991: Iowa’s climate as projected by the global climate model of the Goddard Institute for Space Studies for a doubling of atmospheric carbon dioxide. Journal of the Iowa Academy of Science 98 (4), 153-158.
Des Moines Airport Data Caution: Not corrected for urban heat island effects
Des Moines Airport Data Caution: Not corrected for urban heat island effects
Winter Temperatures are Rising, Fewer Extreme Cold Events Des Moines Data Des Moines Data
Des Moines Airport Data 1983: 13 1988: 10 1977: 8 1974: 7 6 days ≥ 100oF in the last 23 years
Des Moines Airport Data 8 days in 2012 1983: 13 1988: 10 1977: 8 1974: 7 6 days ≥ 100oF in the last 23 years
Iowa State-Wide Average Data 34.0” 10% increase 30.8”
Iowa State-Wide Average Data Totals above 40” 2 years 34.0” 10% increase 30.8”
Iowa State-Wide Average Data Totals above 40” 8 years 2 years 34.0” 10% increase 30.8”
Cedar Rapids Data 32% increase 28.0” 37.0”
Cedar Rapids Data Years with more than 40 inches 11 1 32% increase 28.0” 37.0”
“One of the clearest trends in the United States observational record is an increasing frequency and intensity of heavy precipitation events… Over the last century there was a 50% increase in the frequency of days with precipitation over 101.6 mm (four inches) in the upper midwestern U.S.; this trend is statistically significant “ Karl, T. R., J. M. Melillo, and T. C. Peterson, (eds.), 2009: Global Climate Change Impacts in the United States. Cambridge University Press, 2009, 196pp.
Cedar Rapids Data 67% increase 3.6days 6.0 days
Cedar Rapids Data Number of Years with More than 8 Occurrences 0 9 67% increase 3.6days 6.0 days