Download
1 / 30
300 likes | 322 Views
Learn about post-school data collection, predictors of higher education participation for students with disabilities, and factors influencing student outcomes in Washington state. Explore the latest research findings and charts on post-school engagement.

E N D
Post-school Outcomes: Understanding Post-school Data for Program Improvements Dr. Brendon Taga, Associate Dean Dr. Cinda Johnson, Associate Professor Seattle University
Center for Change in Transition Services • Mission: Improving post-school outcomes for students with disabilities in Washington state. • CCTS analyzes and reports post-school outcomes for all high school students who had an IEP in Washington.
Critical Interrelationship of Indicators Four of the IDEA indicators relate to secondary transition. These indicators also correlate with one another. • Quality IEPs – Indicator 13 • Staying in school – Indicator 2 • Graduating – Indicator 1 • Positive post-school outcomes – Indicator 14 (Kohler, Gothberg, & Hill, "NSTTAC Evaluation Toolkit", 2009)
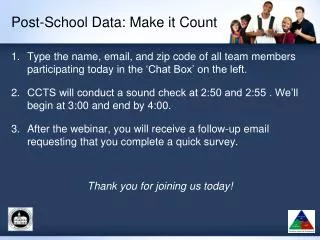
Data Collection How are post-school outcome (PSO) data collected? What data are reported?
How are PSO Data Collected? • The annual Post-School Survey takes place one year after students exit high school by way of graduation, dropping out, or ageing out. • Phone calls are conducted by district/school personnel • Data are recorded in the CCTS’s secure online data collection platform. • CCTS provides district/school with technical assistance as needed.
What Data are Collected? • Demographics (e.g., gender, disability, race/ethnicity) • Work and school experiences • Type of job or school • Number of hours working or in school • Contact with agencies District/school is responsible for tracking leavers and their contact information.
Post-School Outcome Charts and Tables, 2016-17 • The following slides include a selection of the state-level charts that are available on the CCTS website. • Each set of charts is followed by a data table summary.
State – PSO Bar Chart (CCTS 2019, Indicator 14 Post-School Outcome Mini-Report, Washington state, 2016-17)
State – Any Engagement vs. No Engagement, Five-Year Overview Line Graphs (CCTS 2019, Indicator 14 Post-School Outcome Mini-Report, Washington state, 2016-17)
State – Any Engagement vs. No Engagement, Five-Year Overview Summary
Predictors of Higher Education Participation for Students with a Specific Learning Disability:A Secondary Data Analysis of High School Students in Washington State Brendon K. Taga, Ph.D., J.D.
Research Aims & Design • Better understand higher education outcomes for students with specific learning disabilities. • Use data collected through Seattle University’s Center for Change in Transition Services (CCTS). • Explore both student-level and school-level predictors • Hierarchical Generalized Linear Model (HGLM) / Multilevel Logistic Regression
Research Question To what extent is the probability of a Washington state high school student with a specific learning disability participating in higher education impacted by: • five student-level variables (race, gender, primary language, least restrictive environment type or code, and exit status); and • three school-level variables (the proportion of minorities of the school’s student population, the proportion of free and reduced price meal program (FRM) participation of the school’s student population, and student-teacher ratio)?
Outcome Variable (binary) • If the youth is no longer is secondary school; • had an individualized education program (IEP) in effect at the time they left school; • were enrolled on a full-or part-time basis at a community college (two-year program) or a college or university (four- or more years program) for at least one complete term; and • were enrolled at any time in the first year since leaving high school.
Participants • 2,225 survey respondents • Identified as having a Specific Learning Disability (SLD) • Left public secondary schools during the 2013-2014 school year • Distributed across 208 Washington state schools • Schools with fewer than five respondents were excluded from the study
Predictors for Attending Higher Education Overall Probability of SLD Student Participating in Higher Education was 18.7% • Race: Students of color were 1.17 times more likely to participate. • Gender: Female students were 1.89 times more likely to participate. Female students (24.8%) / Male students (14.8%) • Primary Language: Students who identified English as their primary language were 1.28 times more likely to participate.
Predictors, Continued • LRE Type: Students who spent 40% or more of their day in general education classes were 5.15 times more likely to participate. • Exit Status • Those who graduated or completed a GED were 9.53 times more likely to participate than those who do not. • Graduated & GED (21.2%) / Drop & Age Out (2.7%) • Classroom Size: Schools with more teachers or fewer students better support higher education participation.
Personal or family needs, social, life issues • Mental health issues (depression, anxiety, schizophrenia, “anger issues”) • Bullying, humiliation from students and teachers • Pregnancy • Housing issues, homeless, needing to work • Didn’t understand disability
Needs weren’t being met • More “hands on activities”, vocational classes, “real world” • “If I would have more support like academic support, more time to complete assignments and support from the teacher I would had stayed in school.”
Capacity • Got too far behind with health issues • Taking care of grandparents, siblings, family members • “If had a car. Was hard to get to and from school so I gave up.” • “Not having to pay rent, bills, groceries. Richard had no place to live.”
Too far behind (credits) • “I’m in foster care. Didn't have enough credits to graduate.” • “(Young person) was incarcerated for a period of time, and had difficulty getting back to his education.”
What Does the Research Say?(Research Based) • Inclusion in General Education • Occupational Courses • Paid Work Experience • Self-Care/Independent Living Skills • Transition Program • Vocational Education • Work Study • Youth Autonomy Predictors of Post-School Success (NTACT, n.d.)
What Does the Research Say?(Promising) • Career Awareness • Community Experiences • Exit Exam Requirements/High School Diploma Status • Interagency Collaboration • Parental Involvement • Program of Study • Self-Advocacy/Self-Determination • Social Skills • Student Support Predictors of Post-School Success (NTACT, n.d.)
Contact Information Dr. Brendon Taga tagab@seattleu.edu Dr. Cinda Johnson cinda@seattleu.edu Center for Change in Transition Services www.seattleu.edu/ccts
Citations for PSO Charts and Data Center for Change in Transition Services, Seattle University (January, 2019). Indicator 14 Post-School Outcome Mini-Report, Washington state, 2016-2017.
Additional Citations Kohler, P. D., Gothberg, J., & Hill, J. (2009, November 12). NSTTAC Evaluation Toolkit [PDF]. Kalamazoo: Western Michigan University. http://comm.eval.org/HigherLogic/System/DownloadDocumentFile.ashx?DocumentFileKey= 8d43c53a-e804-4647-856c-f783fceccff2&forceDialog=0 National Technical Assistance Center on Transition. (2018, October). Post-School Outcomes: What’s New, How to Find, Improve, and Use Them [PDF]. Presented at DCDT, Cedar Rapids, Iowa. Predictors of Post School Success [PDF]. (n.d.) National Technical Center on Transition. http://transitionta.org/system/files /resources/EPP_Matrix_Preds%20revised.pdf
Creative Commons License Except where otherwise noted, content in this presentation is licensed under a Creative Commons Attribution 4.0 International license. All logos and trademarks are property of their respective owners. You may share and adapt this material, but you must give appropriate credit, provide a link to the license, and indicate if changes were made.