Download
1 / 55
550 likes | 553 Views
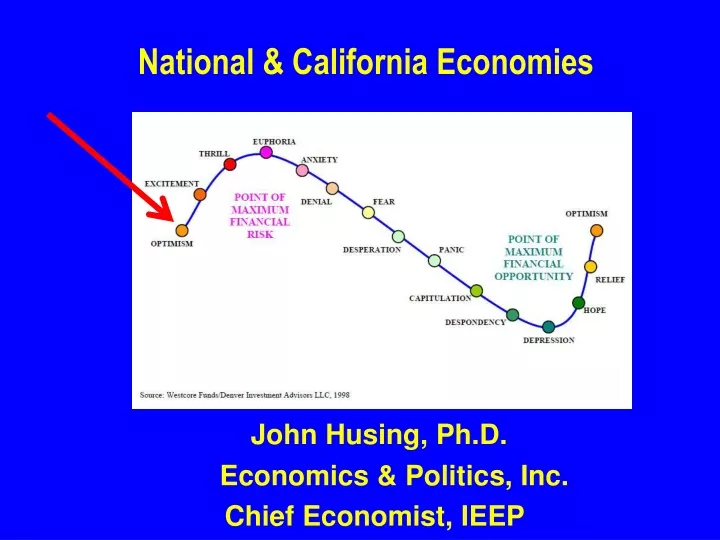
National & California Economies. John Husing, Ph.D. Economics & Politics, Inc. Chief Economist, IEEP. After Losing 8.71 Million Jobs … Now At A Record Level of Jobs U.S. Jobs Long Slow Growth - Not Over-Heating. Gross Domestic Product Very Slow Growth.

E N D
National & California Economies John Husing, Ph.D. Economics & Politics, Inc. Chief Economist, IEEP
After Losing 8.71 Million Jobs … Now At A Record Level of JobsU.S. Jobs Long Slow Growth - Not Over-Heating
Value of the Dollar:Helps Imports & Hurts Exports 100.0 2012-2016 22.1%
Industrial Capacity Utilization: Slack Full Capacity 82.5% 75.5%
U.S. Unemployment History Prime Rate: 21% Cold War Ends Great Recession
Consumer Price Stable: Below 2.0% Fed Target 1.1%
Interest Rate Environment 3.46% 1.62%
Required FICO Scores – 30 Year FixedFannie Mae Share of Income: 36% or less … 680 if LTV 75% … 620 if Less Share of Income: 45% or less … 700 if LTV 75% … 640 if Less Issue: Maximum Allowable Confirming Loan Levels 68.1% 55.1%
California Job Gains/Losses Up 1,074,272 6.8% Up 2007 15,844,325 2016 16,918,587 Recovery 2,253,330 Great Recession -1,179,058
U.S. & CA Unemployment History Prime Rate: 21% Cold War Ends Great Recession
Gold Mine Theory Secondary Tier Primary Tier
Office Vacancy/SF Absorption Bay Area – Rest of CA Split! 2016Q2 Sacramento 15.8% 421,000 Inland Empire 14.1% 64,000 Central Valley 14.0% 24,000 L.A. Co. 13.8% 1,200,000 San Diego 12.5% -119,000 Orange Co. 10.0% -464,000 Contra Costa 8.7% 515,000 SF Peninsula 8.0% -149,000 Silicon Valley 7.9% 360,000 Alameda Co. 7.2% 16,000 San Francisco 6.3% 348,000
Share of Adults, 18-64, No Health InsuranceBy California Region, 2012 vs. 2015
Housing Permits, Single Family ResidentialSeasonally Adjusted Annual Rate
Change In Sales Demand vs. Supply of Active Listings August 2015-2016 Sales: Demand Active Listings: Supply 8% 7% 6% -2% -4% -9% Bay Area Southern California Central Valley
Months of Housing Supply Available By California Region Bay Area So. CA Central Valley 8.0 7.0 6.0 5.0 4.0 3.0 2.0 1.0 0.0 3.6 3.2 2.4
CA: State Prices Almost All The Way Back Median Price Existing Detached Homes, 2005-2016 $594,530 $526,580 5.8% $497,520 -11.4% $245,230 -59%
High Priced Bay Area & Central Coast U.S. = $307,454
Mix Priced So. CaliforniaModestly Priced Central Valley U.S. = $307,454