Download
1 / 16
160 likes | 288 Views
This study explores the application of Kalman filtering for reducing residual noise in signal processing, particularly in the context of spectral subtraction. Residual noise, which arises from inconsistencies in noise modeling and phase differences, compromises signal quality, evidenced by non-ideal Signal-to-Residual-Noise Ratios (SNR). Through analyzing the distribution of residual noise and employing Kalman filters, we aim to improve signal quality and perceptual outcomes. The findings highlight both the advantages and challenges of Kalman filtering in real-world applications.

E N D
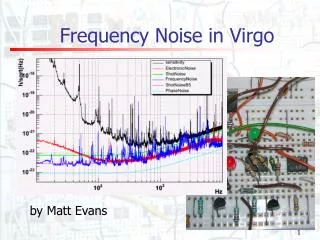
Frequency Kalman Noise Reduction Esfandiar Zavarehei Department of Electronic and Computer Engineering Brunel University 28 July, 2004
Y(ejw) = X(ejw) + N(ejw) |Y(ejw)|2 = |X(ejw)|2 + |N(ejw)|2 + +2 |X(ejw)| |N(ejw)|cos(∆θ) Assuming ∆θ=0 → |Y(ejw)|= |X(ejw)|+ |N(ejw)| which is the assumption in Spectral Subtraction that causes the cross-product to remain in the signal. This remaining noise is called Residual Noise Residual Noise
Noise Model Variations, Another source of Residual Noise • The noise has some fluctuations around its mean
Distribution of Residual Noise • This figure is the histogram of the residual noise for each frequency bin all together plotted as an image
Distribution of Residual Noise • We assume that the distribution of the residual noise is Gaussian and use Kalman Filter to reduce its effect. The figure shows the mean of all histograms across frequency that looks like a Gaussian distribution
Goal • Fluctuations of frequency trajectory centred around f = 761Hz (bin number 20) across time for the clean and noisy signal.
Kalman uses the Variance of the noise. It can use the data in neighbour frequency trajectories for enhanced prediction t=k B C f A D E Advantages of Kalman
Results so far • SNR results do not show the perceptual quality of the output
Noisy Spectral Subtraction Nonlinear Spectral Subtraction SS Kalman SS Kalman with VAD Results so far (cont.)
Results so far (cont.) • The same method could be applied to Mel-Spectrum for recognition purposes
The transition from vowels to consonants and vice versa is not modelled so the Filter might be distracted More sophisticated use of the neighbourhood information and better ways of predicting the values Challenges and future work