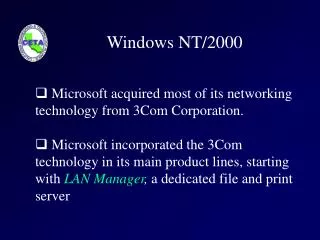
Windows 2000 IO Performance
Windows 2000 IO Performance. Leonard Chung & Jim Gray. Study Goals. Repeat and Extend the Riedel, et. al paper. Many things have changed: Software: Windows 2000 instead of NT4SP3 Hardware: New, faster drives and standards 3 main testing scenarios: old-old: “old” machine with NT4SP6

Windows 2000 IO Performance
E N D
Presentation Transcript
Windows 2000 IO Performance Leonard Chung & Jim Gray
Study Goals • Repeat and Extend the Riedel, et. al paper. • Many things have changed: • Software: Windows 2000 instead of NT4SP3 • Hardware: New, faster drives and standards • 3 main testing scenarios: • old-old: “old” machine with NT4SP6 • old-new: “old” machine with Win2000 • new-new: “new” machine with Win2000
Hardware Configurations • “old” hardware: • 333 MHz PII • 4 x 7200 RPM UW SCSI drives • 128 MB SDRAM • “new” hardware: • 2 x 733 MHz PIII • 4 x 10,000 RPM Ultra160 SCSI drives • 256 MB RDRAM • 4 x 5400 RPM UltraATA/66 IDE drives on a 3ware card
Primary Test Tools • SQLIO – the primary test tool • CacheFlush – buffered sequential • DiskCache – PCI/host adapter throughput • Memspeed – memory subsystem
Testing Methodology • Before each test: • Drive formatted • Test files copied in same order • Test run • Sequential test files made to live on outer edge of disk, giving disk’s max performance and consistent results.
Media Banding • Modern disks are zoned • More bits stored on outer tracks + constant angular velocity = fast outer tracks • We’ve measured inner tracks on some drives being up to 40% slower than the outer tracks • A “normal” disk map…
Overall Findings • Changes in throughput performance are incremental rather than radical • Trendlines have the same general shape • Most of Riedel’s model still holds
30 72 140 9 per disk Hardware Bandwidth (RAP) System Bandwidth: What Riedel Saw in megabytes per second (not to scale!) Hard Disk | SCSI | PCI | Memory | Processor
40 133 422 15 per disk Hardware Bandwidth (PAP) System Bandwidth Yesterday in megabytes per second (not to scale!) Hard Disk | SCSI | PCI | Memory | Processor
The familiar bandwidth pyramid: The farther from the CPU, the less the bandwidth. 40 133 422 15 per disk Hardware Bandwidth (PAP) System Bandwidth Yesterday in megabytes per second (not to scale!) Hard Disk | SCSI | PCI | Memory | Processor
The familiar pyramid is gone! PCI is now the bottleneck! In practice, 3 disks can reach saturation using sequential IO 26 26 160 133 1,600 26 Hardware Bandwidth (PAP) System Bandwidth Today in megabytes per second (not to scale!) Hard Disk | SCSI | PCI | Memory | Processor
26 26 160 532 1,600 26 Hardware Bandwidth (PAP) System Bandwidth Today in megabytes per second (not to scale!) Possible solutions: A fatter, 64bit 66MHz PCI bus or… Hard Disk | SCSI | PCI | Memory | Processor
26 26 26 26 160 160 133 133 1,600 26 26 Hardware Bandwidth (PAP) System Bandwidth Today in megabytes per second (not to scale!) Possible solutions: A fatter, 64bit 66MHz PCI bus or… multiple PCI busses Hard Disk | SCSI | PCI | Memory | Processor
98.5 975 98.5 Hardware Bandwidth (RAP) System Bandwidth Today (reads) Numbers we’ve seen in megabytes per second (not to scale!) 24 each Hard Disk | SCSI | PCI | Memory | Processor
NT4SP3 Buffered Overhead 80 Read 70 Write 60 Write + WCE 50 40 Overhead (cpu ms/MB) Write 30 20 Read 10 0 2 4 8 16 32 64 128 192 Request Si ze (K Bytes) old-old:NT4SP3 vs. NT4SP6 • Unbuffered read and WCE writes no longer show decrease in throughput • Buffered read bug is gone • Overheads are different NT4SP3 NT4SP6
old-new:Windows 2000 • Software: Major changes, minor differences • Dmio: The volume manager for Win2K • More fixed overhead than ftdisk due to longer code paths • More features than ftdisk (dynamically size volumes, etc.) • In the end, performance is the same. • Processors are fast enough that there are more than enough cycles to spare.
new-new:Windows 2000 • Hardware: The American Way • Faster, bigger, cheaper • Disks are now 4 times bigger and 3 times faster. • SCSI bus bandwidth has surpassed the PC-standard 32bit, 33MHz PCI bus bandwidth. • Random IO is unaffected by the PCI bottleneck. • Additional SMP processor provided no additional throughput gains.
PCI Bottleneck new-new:Windows 2000 Scalability
new-new:Windows 2000 & IDE • The real IO revolution: RAID priced for the masses! • The good news: • IDE disks are cheap • We bought 5400 RPM IDE 27GB drives for $209 ($7.75/GB) while our 10,000 RPM 18GB SCSI drive cost $534 ($30/GB) • IDE costs $3.17 per Kaps while SCSI costs $5.09 per Kaps. • Today, IDE is $6,500 per TB while SCSI costs $16,000
new-new:Windows 2000 & IDE • IDE Performance: • Single disk random IO performance on a 5400 RPM IDE is much slower than a 10,000 SCSI. • However, multiple IDE disks can provide up to • 60% more Kaps for the same price as a single • SCSI disk.
new-new:Windows 2000 & IDE • IDE Performance: • Single disk sequential IO throughput on a 5400 RPM IDE drive is 80% of the more expensive 10,000 RPM SCSI drive.
new-new:Windows 2000 & IDE • Price/Performance for IDE is hard to beat • Performance • For sequential and random IO, IDE is price/performance leader • Overhead for SCSI and 3ware/DMA IDE is the same. • Capacity • 69GB (~2.5 disks worth) of Quantum Fireball lct08s costs the same as one Quantum Atlas 10K 18GB disk.
new-new:Windows 2000 & IDE • The bad news about IDE • The quality of IDE controllers varies Revolutions are being missed due to slow controller
Missing every other revolution Missing multiple revolutions new-new:Windows 2000 & IDE • The bad news about IDE High controller overhead is causing the disk to miss revolutions at small request sizes
new-new:Windows 2000 & IDE (3ware) • The bad news about IDE • IDE RAID isn’t as mature as SCSI • Driver bugs and incompatibilities • Problems with multiple IDE drives • IDE spec gives 18” as the max cable length: getting cables to drives can be a chore • Avoid master/slave: reliability and possibly performance is lost • No hot swap
new-new:Windows 2000 & IDE (3ware) • The bad news about IDE • RAID isn’t as mature as SCSI • 3ware’s card peaks out at 55MBps for reads and 40MBps for writes; 3 disks for reads and 2 for writes.
Where do we go from here? • Network IO over Gigabit • OOB performance and slight tuning • Sqlio2: a complete rewrite of SQLIO
And in conclusion… • NT4SP6 • Unbuffered requests at 2KB, 4KB request sizes no longer have dip • Buffered read request bug gone • Buffered overhead appears to be lower • Windows 2000 • Despite dmio replacing ftdisk, throughput remains unaffected
And in conclusion… • new-new SCSI performance • PCI is now the bottleneck with 3 drives able to reach saturation • new-new IDE • IDE shows a lot of promise: cheap storage and good performance • Difficulty lies with multiple disks • IDE RAID cards not quite ready for prime time • Physically wiring the drives