Download
1 / 17
170 likes | 286 Views
A study comparing various SVAT models for water and energy budgets, snow and discharge simulations. Findings show strengths and weaknesses across schemes, with insights into snow depth and discharge accuracies.

E N D
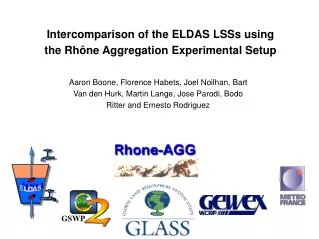
Intercomparison of the ELDAS LSSs using the Rhône Aggregation Experimental Setup Aaron Boone, Florence Habets, Joel Noilhan, Bart Van den Hurk, Martin Lange, Jose Parodi, Bodo Ritter and Ernesto Rodriguez GSWP
Objectives: • Projet: GEWEX Rhône: GLASS, GSWP2 • International Inter-comparison Project 15 (+ 3 ELDAS) SVATs • 3 year simulation (1986-1989) of regional-scale water and energy budgets (ELDAS) • Evaluation of snow and discharge simulations (ELDAS) • Impact of changing spatial scale on the simulations SAFRAN SVAT MODCOU weather runoff Evaluation using observations Discharge Snow
ELDAS SVATs: ISBA = CNRM Météo-France ECMWF = European Center for Medium Range Weather Forecasts TECMWF = modified ECMWF: KNMI Dutch Weather Service DWD = German Weather Service INM = Spanish NWP Dept.
Results: • Snow evaluation using snowdepth at 24 sites over 3 years: daily obs • Best simulations by « explicit » snow schemes • « Composite » snow schemes underestimated snow depth/SWE: precocious melt • SnowDepth and SWE consistent • Poor discharge simulations by « explicit » snow schemes for mountainous basins (eg. Durance) SWAP: best simulation (in red) as a reference: ISBA and DWD « explicit », TECMWF (snow tile), INM = « composite »
Total runoff spatial pattern similar • Surface (fast) runoff on left • Drainage (slow component) on right • Partitioning primarily a fn of sub-grid runoff scheme • Partitioning effects daily discharge 3 yr AVG runoff components.
Discharge: • Viviers represents 80% of basin surface • Best schemes: approximately 20% of total runoff is surface runoff (fast response) • Sub-grid runoff more important for smaller basins: eg. INM_r (rerun) • Bucket-type schemes showed no skill (ORCHIDEE, CHASM) 3-year average monthly discharge: statistics using daily observations
Discharge: • Correlation squared for 100 basins using daily observations. Normalized frequency shown. • DWD_r slightly improved (soil model) • INM_r (include sub-grid runoff): significant improvement compared to INM • TECMWF: best of 3 ECMWF schemes (ECMWF has no sub-grid runoff) • ISBA uses a simple VIC-based sub-grid runoff (constant parameter) Histograms of discharge simulation for 100 basins: correlation squared: best simulations skewed to right
Conclusions: • ELDAS results generally consistent with Rhone-AGG default schemes • SnowDepth only simulated well by « explicit » or « snow tile-devoted » schemes. « Composite » schemes (eg. INM) underestimate SWE • Dischage: sub-grid runoff more critical for medium to small sized basins (eg. Ardeche), and « explicit » snow required for mountanous basins • Soil Moisture highly variable among schemes: equilibrium a fn of interplay between runoff (esp. Sub-grid), evapotranpiration and soil model: ISBA relatively dry compared to other models (due to field capacity Force-Restore parameter) • Soil moisture tendency phase and amplitude in good agreement among most schemes • Major improvements: DWD snow scheme, INM runoff (addition of VIC-type scheme), TECMWF (weaker topographic variability response, Clapp and Hornberger parameter model)
The Safran-Isba-Modcou (SIM) model: • SIM: real-time ‘off-line’ simulation of the surface energy and water budgets and the daily river flows over France: • Safran: OI interpolation of the atmpospheric forcing from surface network at 8 km over France and hourly time step • ISBA: surface fluxes, soil moisture, runoff, snow • MODCOU: daily riverflows and underground water (Seine basin) • SIM: calibrated for the Garonne, Rhone, Seine and Loire river basins on the long term ( 7 to 20 years) • Possible use of SIM outputs in Eldas: • Comparison of SWI from Eldas assimilation and from SIM over France for year 2000 • Comparison of Eldas monthly runoff with riverflows of large basins for 2000
Le système SAFRAN-ISBA-MODCOU (SIM) AnalysesARPEGE ou ECMWF Observations de surface entrées AnalyseSAFRAN Forçage atmosphérique: Pluie, neige, humidité rayonnements incidents, température,vent… sorties E Schéma de surface Photosynthèse, Végétation interactive H ISBA G + Neige Données physiographiques pour le sol et la végétation Qr Qi Rétroactionde la nappe sur l’humidité des sols Débits journaliers Modèle hydrologique Modcou • Nappe
Densité d’observation des variables atmosphériques Réseau synoptique (Ta, Qa, Ua,Nébulosité, Ryt global, pression) Précipitation journalière
Carte végétation ecoclimap • Base végétation Ecoclimap à 1km • carte des sols: INRA (en France), FAO (ailleurs) • Carte de végétation: en France: • Corine + carte de climat + archives données satellites NDVI Les classes de culture
Réseau hydrographique Déduit de la topographie 1 km et d’un S.I.G., corrigé à partir des atlas et des données de la banque Hydro 181373 mailles de 1 à 8 km de coté 20603 mailles rivières 900 stations hydrométriques simulées
Application de SIM France Paramètres physiograhiques fournis par Ecoclimap Evolution végétation donnée par Vegetation 2000