Download
1 / 23
340 likes | 708 Views
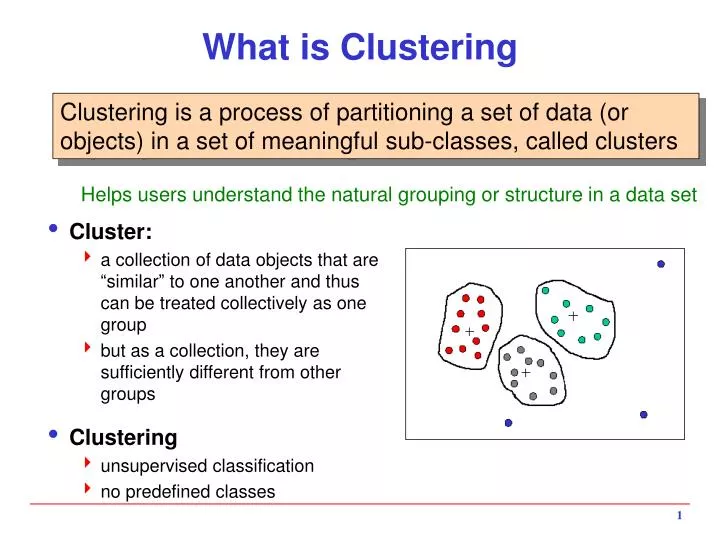
What is Clustering. Cluster: a collection of data objects that are “ similar ” to one another and thus can be treated collectively as one group but as a collection, they are sufficiently different from other groups Clustering unsupervised classification no predefined classes.

E N D
What is Clustering • Cluster: • a collection of data objects that are “similar” to one another and thus can be treated collectively as one group • but as a collection, they are sufficiently different from other groups • Clustering • unsupervised classification • no predefined classes Clustering is a process of partitioning a set of data (or objects) in a set of meaningful sub-classes, called clusters Helps users understand the natural grouping or structure in a data set
Requirements of Clustering Methods • Scalability • Dealing with different types of attributes • Discovery of clusters with arbitrary shape • Minimal requirements for domain knowledge to determine input parameters • Able to deal with noise and outliers • Insensitive to order of input records • The curse of dimensionality • Interpretability and usability
Applications of Clustering • Clustering has wide applications in Pattern Recognition • Spatial Data Analysis: • create thematic maps in GIS by clustering feature spaces • detect spatial clusters and explain them in spatial data mining • Image Processing • Market Research • Information Retrieval • Document or term categorization • Information visualization and IR interfaces • Web Mining • Cluster Web usage data to discover groups of similar access patterns • Web Personalization
Clustering Methodologies • Two general methodologies • Partitioning Based Algorithms • Hierarchical Algorithms • Partitioning Based • divide a set of N items into K clusters (top-down) • Hierarchical • agglomerative: pairs of items or clusters are successively linked to produce larger clusters • divisive: start with the whole set as a cluster and successively divide sets into smaller partitions
Distance or Similarity Measures • Measuring Distance • In order to group similar items, we need a way to measure the distance between objects (e.g., records) • Note: distance = inverse of similarity • Often based on the representation of objects as “feature vectors” Term Frequencies for Documents An Employee DB Which objects are more similar?
Distance or Similarity Measures • Properties of Distance Measures: • for all objects A and B, dist(A, B) ³ 0, and dist(A, B) = dist(B, A) • for any object A, dist(A, A) = 0 • dist(A, C) £ dist(A, B) + dist (B, C) • Common Distance Measures: • Manhattan distance: • Euclidean distance: • Cosine similarity: Can be normalized to make values fall between 0 and 1.
Distance or Similarity Measures • Weighting Attributes • in some cases we want some attributes to count more than others • associate a weight with each of the attributes in calculating distance, e.g., • Nominal (categorical) Attributes • can use simple matching: distance=1 if values match, 0 otherwise • or convert each nominal attribute to a set of binary attribute, then use the usual distance measure • if all attributes are nominal, we can normalize by dividing the number of matches by the total number of attributes • Normalization: • want values to fall between 0 an 1: • other variations possible
Distance or Similarity Measures • Example • max distance for age: 100000-19000 = 79000 • max distance for age: 52-27 = 25 • dist(ID2, ID3) = SQRT( 0 + (0.04)2 + (0.44)2 ) = 0.44 • dist(ID2, ID4) = SQRT( 1 + (0.72)2 + (0.12)2 ) = 1.24
Domain Specific Distance Functions • For some data sets, we may need to use specialized functions • we may want a single or a selected group of attributes to be used in the computation of distance - same problem as “feature selection” • may want to use special properties of one or more attribute in the data • natural distance functions may exist in the data Example: Zip Codes distzip(A, B) = 0, if zip codes are identical distzip(A, B) = 0.1, if first 3 digits are identical distzip(A, B) = 0.5, if first digits are identical distzip(A, B) = 1, if first digits are different Example: Customer Solicitation distsolicit(A, B) = 0, if both A and B responded distsolicit(A, B) = 0.1, both A and B were chosen but did not respond distsolicit(A, B) = 0.5, both A and B were chosen, but only one responded distsolicit(A, B) = 1, one was chosen, but the other was not
Distance (Similarity) Matrix • Similarity (Distance) Matrix • based on the distance or similarity measure we can construct a symmetric matrix of distance (or similarity values) • (i, j) entry in the matrix is the distance (similarity) between items i and j Note that dij = dji (i.e., the matrix is symmetric. So, we only need the lower triangle part of the matrix. The diagonal is all 1’s (similarity) or all 0’s (distance)
Example: Term Similarities in Documents Term-Term Similarity Matrix
Similarity (Distance) Thresholds • A similarity (distance) threshold may be used to mark pairs that are “sufficiently” similar Using a threshold value of 10 in the previous example
T3 T1 T5 T4 T2 T7 T6 T8 Graph Representation • The similarity matrix can be visualized as an undirected graph • each item is represented by a node, and edges represent the fact that two items are similar (a one in the similarity threshold matrix) If no threshold is used, then matrix can be represented as a weighted graph
Simple Clustering Algorithms • If we are interested only in threshold (and not the degree of similarity or distance), we can use the graph directly for clustering • Clique Method (complete link) • all items within a cluster must be within the similarity threshold of all other items in that cluster • clusters may overlap • generally produces small but very tight clusters • Single Link Method • any item in a cluster must be within the similarity threshold of at least one other item in that cluster • produces larger but weaker clusters • Other methods • star method - start with an item and place all related items in that cluster • string method - start with an item; place one related item in that cluster; then place anther item related to the last item entered, and so on
Simple Clustering Algorithms • Clique Method • a clique is a completely connected subgraph of a graph • in the clique method, each maximal clique in the graph becomes a cluster T3 T1 Maximal cliques (and therefore the clusters) in the previous example are: {T1, T3, T4, T6} {T2, T4, T6} {T2, T6, T8} {T1, T5} {T7} Note that, for example, {T1, T3, T4} is also a clique, but is not maximal. T5 T4 T2 T7 T6 T8
Simple Clustering Algorithms • Single Link Method • selected an item not in a cluster and place it in a new cluster • place all other similar item in that cluster • repeat step 2 for each item in the cluster until nothing more can be added • repeat steps 1-3 for each item that remains unclustered T3 T1 In this case the single link method produces only two clusters: {T1, T3, T4, T5, T6, T2, T8} {T7} Note that the single link method does not allow overlapping clusters, thus partitioning the set of items. T5 T4 T2 T7 T6 T8
Clustering with Existing Clusters • The notion of comparing item similarities can be extended to clusters themselves, by focusing on a representative vector for each cluster • cluster representatives can be actual items in the cluster or other “virtual” representatives such as the centroid • this methodology reduces the number of similarity computations in clustering • clusters are revised successively until a stopping condition is satisfied, or until no more changes to clusters can be made • Partitioning Methods • reallocation method - start with an initial assignment of items to clusters and then move items from cluster to cluster to obtain an improved partitioning • Single pass method - simple and efficient, but produces large clusters, and depends on order in which items are processed • Hierarchical Agglomerative Methods • starts with individual items and combines into clusters • then successively combine smaller clusters to form larger ones • grouping of individual items can be based on any of the methods discussed earlier
K-Means Algorithm • The basic algorithm (based on reallocation method): 1. select K data points as the initial representatives 2. for i = 1 to N, assign item xi to the most similar centroid (this gives K clusters) 3. for j = 1 to K, recalculate the cluster centroid Cj 4. repeat steps 2 and 3 until these is (little or) no change in clusters • Example: Clustering Terms Initial (arbitrary) assignment: C1 = {T1,T2}, C2 = {T3,T4}, C3 = {T5,T6} Cluster Centroids
Example: K-Means • Example (continued) Now using simple similarity measure, compute the new cluster-term similarity matrix Now compute new cluster centroids using the original document-term matrix The process is repeated until no further changes are made to the clusters
K-Means Algorithm • Strength of the k-means: • Relatively efficient: O(tkn), where n is # of objects, k is # of clusters, and t is # of iterations. Normally, k, t << n • Often terminates at a local optimum • Weakness of the k-means: • Applicable only when mean is defined; what about categorical data? • Need to specify k, the number of clusters, in advance • Unable to handle noisy data and outliers • Variations of K-Means usually differ in: • Selection of the initial k means • Dissimilarity calculations • Strategies to calculate cluster means
Hierarchical Algorithms • Use distance matrix as clustering criteria • does not require the number of clusters k as an input, but needs a termination condition
Hierarchical Agglomerative Clustering • HAC starts with unclustered data and performs successive pairwise joins among items (or previous clusters) to form larger ones • this results in a hierarchy of clusters which can be viewed as a dendrogram • useful in pruning search in a clustered item set, or in browsing clustering results • Some commonly used HACM methods • Single Link: at each step join most similar pairs of objects that are not yet in the same cluster • Complete Link: use least similar pair between each cluster pair to determine inter-cluster similarity - all items within one cluster are linked to each other within a similarity threshold • Ward’s method: at each step join cluster pair whose merger minimizes the increase in total within-group error sum of squares (based on distance between centroids) - also called the minimum variance method • Group Average (Mean): use average value of pairwise links within a cluster to determine inter-cluster similarity (i.e., all objects contribute to inter-cluster similarity)
Hierarchical Agglomerative Clustering Dendrogram for a hierarchy of clusters A B C D E F G H I