The Coded Wire Tag Program for Conservation Monitoring and Evaluation
Explore how Coded Wire Tags support essential monitoring and evaluation in salmon conservation programs, like the Snake River Fall Chinook Salmon program, to assess hatchery strategies, stock composition, and genetic integrity.

The Coded Wire Tag Program for Conservation Monitoring and Evaluation
E N D
Presentation Transcript
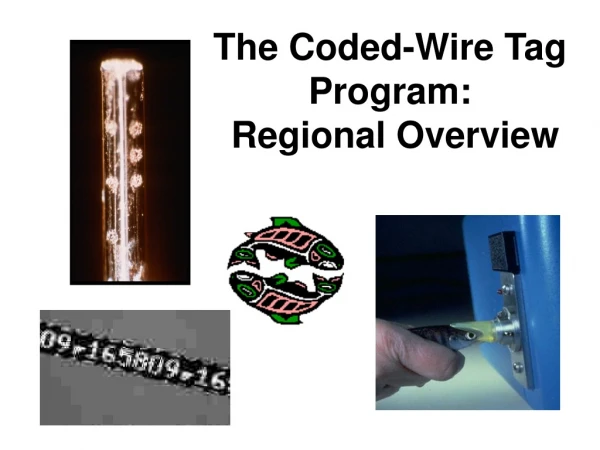
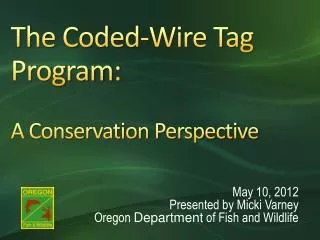
The Coded-Wire Tag Program:A Conservation Perspective May 10, 2012 Presented by Micki Varney Oregon Department of Fish and Wildlife
Monitoring and Evaluation (M & E) are essential components of ESA Recovery Plans and Artificial Production Programs • Evaluate Performance objectives • Gauge effectiveness of recovery measures • Measure progress toward recovery and mitigation goals • Maintain accountability • Provide basis for adaptive management
Coded-Wire Tags are Essential M & E Tools • Hatchery Evaluation/Management • Evaluate hatchery rearing and release strategies • Estimate Contributions to fisheries • Brood stock management • Smolt-to-Adult Return Rates (SAR’s) • Wild/Hatchery proportions, pHOS • Run size and composition • Distribution and abundance (fisheries and on spawning grounds)
Snake River Area Map Rkm 173 Rkm 95 Mouth of Snake River (Col Rkm 522) Rkm 346 Hells Canyon Dam Rkm 397.4
Historical Fall Chinook Returns to the Snake Basinand timing of Lower Snake Dam Construction1962-1985 (Ice Harbor Dam Window Counts) Ice Harbor Lower Monumental Little Goose Lower Granite
Lower Snake River Fish and Wildlife Compensation Plan (LSRCP) - 1976 • Mitigate for juvenile passage mortality and direct loss of spawning area for 5,000 fall Chinook • Return 18,300 adults/year to the Snake River Basin • In-place and in-kind (maintain genetic integrity)
Roles of Players in the Egg Bank Program 1976 Hagerman Hatchery Mid-Snake Juvenile releases Little Goose Dam Kalama Falls Hatchery Lower Columbia River Juvenile releases and collection of Returning Adults Ice Harbor Dam Lower Snake River Adult Collection Lyons Ferry Hatchery Lower Snake River Juvenile releases and Adult collection 1986
Early Lyons Ferry Hatchery Fall Chinook Production Goals (to return 18,300 adults to Snake River Basin) • 9.16 million subyearling smolts (101,880 lbs) • at 90 fpp (80 mm) • expected smolt-to-adult return (SAR) of 0.2% • Idaho Power Co. mitigation for Hells Canyon Complex • for 1.3 million eyed eggs • due after LFH reached 80% of capacity
Stock Composition at Lyons Ferrybased on CWT expansions Very high stray rate—could jeopardize the SRF stock integrity
Program Adjustments to Maintain Genetic Integrity: • 1989 Brood Progeny • Initiated 100% wire-tagging • Modified broodstock collection protocol • LGR trapping • Unmarked fish • Beginning in 1990, CWT’s were read prior to combining the gametes Fall Chinook trapped at Lower Granite Dam
CWT’s continued to play an Integral role in Providing the Data Necessary to Guide Management Decisions • Yearling/Subyearling Comparative Survival Study (1985-1990) • Snake River Fall Chinook ESA Listed as threatened in 1992 • Fall Chinook Acclimation Program (FCAP)-1996
Lyons Ferry Fall Chinook Survival Rate Comparisons from CWT recoveries (On-Station Releases Only) Subyearling Mean = 0.05 Yearling Mean = 0.59
1997 1998 1996
Natural Production 2008 Total: 3,055
120Fall Chinook Redds located in the Clearwater River near Big Canyon Creek 2007.
Hatchery Spawners Natural Spawners pNOB = PNI + pNOB pHOS Proportionate Natural Influence (PNI) pNOB =proportion of broodstock consisting of natural-origin fish pNOB pHOS pHOS=proportion of fish spawning in wild consisting of hatchery-origin fish
Lower Granite Dam Run Reconstruction • Stock and age compostion of fall Chinook run to Lower Granite Dam • Stray rates • Run timing • Jack proportions • Hatchery/Wild • Estimate the number of natural origin Snake River fall Chinook for ESA (natural spawner abundance
Pre-and Post- Trapping Periods Trapping Period Lower Granite Fall Chinook Run Reconstruction Process Separate Run Comp Estimates are calculated for: Multiply by the Inverse of Trap Rate NPTH swim-ins Harvest above LGR Unique Fall Chinook Arriving at LGR Hauled to Hatchery Downstream passage Run to LGR During Trapping Period Expanded Window counts pre and post trapping = + # unique Fish Trapped in Sample Abundance of Potential Spawners
Determining The Hatchery/Wild Proportion-- A Process of Elimination Estimate untagged hatchery fish associated with CWT recoveries (Ad Only and unmarked) WILD Determine Composition By Origin, Sex and Age CLIPPED CLIPPED UNCLIPPED UNCLIPPED Hauled to LFH or NPTH Released above LGR Determine composition of CWT fish Determine composition of Untagged fish Coded-Wire Tagged Fish Assign Lost tags Fish Trapped in Sample At Lower Granite Adult Trap Untagged fish PIT Tags DNA Scale Analysis *Age, Origin? H/W Origin?H/W? *Age, life history, Origin? Definite Age, Origin, Release Location and Rearing info WILD HATCHERY
Finally, after all the calculations, an estimate of the composition of the fall Chinook run to LGR Dam is completed
The CWT Program is a Proven Tool for Providing the Data Necessary for Science-Based Adaptive Management Decisions Recovery Conservation Hatcheries
ACKNOWLEDGEMENTS Bonneville Power Administration Washington Dept. of Fish and Wildlife US Fish and Wildlife Service Nez Perce Tribe Additional photos: David Frame, Mike Key