Download
1 / 32
320 likes | 460 Views
EARLI 11th Biennial conference 2005 Development of edumetrical indices for the analysis of the spectral quality of higher education standardized tests Jean-Luc Gilles http://www.smart.ulg.ac.be/earli-2005/spectral-analysis.ppt Système Méthodologique d’Aide à la Réalisation de Tests

E N D
EARLI 11th Biennial conference 2005 Development of edumetrical indices for the analysis of the spectral quality of higher education standardized tests Jean-Luc Gilles http://www.smart.ulg.ac.be/earli-2005/spectral-analysis.ppt Système Méthodologique d’Aide à la Réalisation de Tests University of Liège - Belgium EARLI 11th Biennial conference 2005 - Development of edumetrical indices for the analysis of the spectral quality of higher education standardized tests – Jean-Luc Gilles
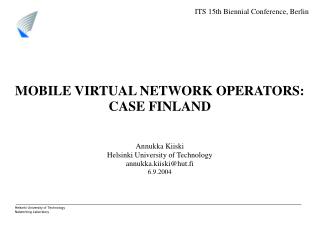
Introduction: Example of Multiple Choice Question:(Hansen & al, 2000) This ultrasound of the left ovary of a 6 years old cow, has been realized one week after the oestrus.Diagnostic : 1. a follicle of de Graaf 2. a follicular cyst 3. a yellow body 4. a cavitary yellow body 5. an artifact 6. none 7. all Example of confidence degrees scale(Leclercq & Gilles, 2000):The student is invited to accom-pany his choice by the percen-tage of chances that his answer will be correct. 3,9 cm 2,8 cm With an optical mark reading deviceit is possible to read automatically answers and confidence degrees of hundreds of students: If you consider you have a probability of correct answer of Check 1,5 cm 0 1 2 3 4 5 0 % 20 % 40 % 60 % 80 % 100 % 0,6 cm EARLI 11th Biennial conference 2005 - Development of edumetrical indices for the analysis of the spectral quality of higher education standardized tests – Jean-Luc Gilles
Introduction: Without confidence degrees, the selected solution of a MCQ is either correct or incorrect. The answer is: With the confidence degrees technique it is possible to bypass the "binary" character of students assessment performance and to consider a more spectral conception of a person’s performances 0 1 2 3 4 5 5 4 3 2 1 0 incorrect correct Confidence degrees 100% 0% 100% 60% 40% 40% 60% Assured performance The worst situation mistaken dangerous partial perfect Knowledge Ignorance Knowledge With the confidence degrees technique it is possibleto deliver more subtle feedback on each person's spectral performances! (Jans & Leclercq, 1999) EARLI 11th Biennial conference 2005 - Development of edumetrical indices for the analysis of the spectral quality of higher education standardized tests – Jean-Luc Gilles
Starting intuition for the new indices used for highlighting problematic MCQs and, within those, the proposals which contain anomalies: Confidence degrees of the students who answer correctly Confidence degrees of the students who answer incorrectly We have exploited the confidence degrees provided by the students to provide spectral information on the quality of the questions (as opposed to information on the quality of students’ performances). Spectral quality of the question EARLI 11th Biennial conference 2005 - Development of edumetrical indices for the analysis of the spectral quality of higher education standardized tests – Jean-Luc Gilles
Starting intuition for the new indices used for highlighting problematic MCQs and, within those, the proposals which contain anomalies: Confidence degrees of the students who answer correctly Confidence degrees of the students who answer incorrectly EARLI 11th Biennial conference 2005 - Development of edumetrical indices for the analysis of the spectral quality of higher education standardized tests – Jean-Luc Gilles
Starting intuition for the new indices used for highlighting problematic MCQs and, within those, the proposals which contain anomalies: Confidence degrees of the students who answer correctly Confidence degrees of the students who answer incorrectly EARLI 11th Biennial conference 2005 - Development of edumetrical indices for the analysis of the spectral quality of higher education standardized tests – Jean-Luc Gilles
Starting intuition for the new indices used for highlighting problematic MCQs and, within those, the proposals which contain anomalies: Confidence degrees of the students who answer correctly Confidence degrees of the students who answer incorrectly EARLI 11th Biennial conference 2005 - Development of edumetrical indices for the analysis of the spectral quality of higher education standardized tests – Jean-Luc Gilles
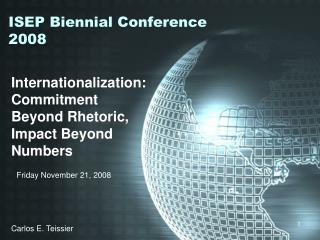
Starting intuition for the new indices used for highlighting problematic MCQs and, within those, the proposals which contain anomalies: 5 5 5 5 4 4 4 4 3 3 3 3 2 2 2 2 1 1 1 1 Spectral coherence 0 0 0 0 Spectral inconsistency Confidence degrees of the students who answer correctly Confidence degrees of the students who answer incorrectly Our starting intuition is as follows: logically the students who answer a question correctly (here in green) should provide percentages of certainty higher than the students who answer incorrectly (in red) EARLI 11th Biennial conference 2005 - Development of edumetrical indices for the analysis of the spectral quality of higher education standardized tests – Jean-Luc Gilles
How can we calculatespectral coherence ? We propose to distinguish the case of the spectral coherence of a correct answer and the case of spectral coherence of an incorrect solution… EARLI 11th Biennial conference 2005 - Development of edumetrical indices for the analysis of the spectral quality of higher education standardized tests – Jean-Luc Gilles
Spectral contrasted point biserial correlation for the correct solution: 4. was having / waited 3. had / was waiting 1. was having / was waiting Correct answer 2. had / waited Confidence Degrees (CD) of the students. S4 OM S1 S3 S2 CD Student 1 Student 2 Student 3 Student 4 Student 5 Student 6 Student 7 Student 8 Student 9 Student 10 Student 11 Student 12 Student 13 Student 14 Student 15 Student 16 Student 17 Student 18 Student 19 Student 20 Complete: He ……….. a heart attack while he ……….. for the bus. 1. was having / was waiting 2. had / waited 3. had / was waiting 4. was having / waited An example of MCQ ... EARLI 11th Biennial conference 2005 - Development of edumetrical indices for the analysis of the spectral quality of higher education standardized tests – Jean-Luc Gilles
Spectral contrasted point biserial correlation for the correct solution: 3. had / was waiting Correct answer Confidence Degrees (CD) of the students. Student 1 Student 2 CD Student 3 Confidence degrees of the students who answer correctly Student 4 5 Student 5 Student 6 4 Student 7 Student 8 3 Student 9 Student 10 2 Student 11 Student 12 1 Student 13 Student 14 0 Student 15 Student 16 Student 17 Student 18 Student 19 Student 20 Complete: He ……….. a heart attack while he ……….. for the bus. 1. was having / was waiting 2. had / waited 3. had / was waiting 4. was having / waited Which are the confidence degrees of the students who chose the correct solution “S3”? S3 EARLI 11th Biennial conference 2005 - Development of edumetrical indices for the analysis of the spectral quality of higher education standardized tests – Jean-Luc Gilles
Spectral contrasted point biserial correlation for the correct solution: 3. had / was waiting Correct answer Confidence Degrees (CD) of the students. Student 1 Confidence degrees of the students who answer incorrectly Student 2 CD Student 3 Confidence degrees of the students who answer correctly Student 4 5 5 Student 5 Student 6 4 4 Student 7 Student 8 3 3 Student 9 Student 10 2 2 Student 11 Student 12 1 1 Student 13 Student 14 0 0 Student 15 Student 16 Student 17 Student 18 Student 19 Student 20 Complete: He ……….. a heart attack while he ……….. for the bus. 1. was having / was waiting 2. had / waited 3. had / was waiting 4. was having / waited Which are the confidence degrees of the students who answer incorrectly? S3 EARLI 11th Biennial conference 2005 - Development of edumetrical indices for the analysis of the spectral quality of higher education standardized tests – Jean-Luc Gilles
Spectral contrasted point biserial correlation for the correct solution: with DxC= the average of the confidence Degrees of the students who chose the correct solution DaC= the average of the confidence Degrees of the other students who did not choose the correct solution = the standard deviation of the confidence degrees of all the students p = the proportion of students who chose the correct solution of the question q = the proportion of students who did not choose the correct solution of the question (q = 1 - p) EARLI 11th Biennial conference 2005 - Development of edumetrical indices for the analysis of the spectral quality of higher education standardized tests – Jean-Luc Gilles
Spectral contrasted point biserial correlation for the correct solution: 3. had / was waiting Correct answer Confidence Degrees (CD) of the students. Student 1 Student 2 CD Student 3 Dac Dxc Student 4 pq rpb SCC= Student 5 Student 6 Student 7 Student 8 Student 9 rpb SCCfor the correct answer « S3 » = 0,76 Student 10 Student 11 Student 12 Student 13 Student 14 1 -1 0 Student 15 The results obtained for the correct solution “S3” are coherent from a spectral point of view Student 16 Student 17 Student 18 Student 19 Student 20 Complete: He ……….. a heart attack while he ……….. for the bus. 1. was having / was waiting 2. had / waited 3. had / was waiting 4. was having / waited S3 By applying the formula: EARLI 11th Biennial conference 2005 - Development of edumetrical indices for the analysis of the spectral quality of higher education standardized tests – Jean-Luc Gilles
and for the measurement of the spectral coherence of an incorrect solution ? It is here that we propose a Contrasted treatment! EARLI 11th Biennial conference 2005 - Development of edumetrical indices for the analysis of the spectral quality of higher education standardized tests – Jean-Luc Gilles
Spectral contrasted point biserial correlation for an incorrect solution: Contrasted Treatment = Elimination of the « background noise » generated by the data of the other incorrect answers After contrasted treatment, we calculate the point biserial correlation using the columns « S1 » and « CD »: rpb SCI of « S1 » = -0.83 1 -1 0 Incorrect solution Correct solution CD S1 S3 0 Student 2 1 Student 3 1 Student 4 1 Student 6 1 Student 9 0 Student 12 1 Student 13 0 Student 14 0 Student 19 1 Student 20 EARLI 11th Biennial conference 2005 - Development of edumetrical indices for the analysis of the spectral quality of higher education standardized tests – Jean-Luc Gilles
The turbo analysis? EARLI 11th Biennial conference 2005 - Development of edumetrical indices for the analysis of the spectral quality of higher education standardized tests – Jean-Luc Gilles
Turbo analysis principle and realism calculation for the Spectral Contrasted point biserial correlation (rpbSCT): Correct answer We calculate the index of Realism (Rs) for each student REALISM (Rs) Student 3 Student 4 Student 5 Student 6 Student 7 Student 8 Student 9 Student 10 Student 11 Student 12 Student 13 Student 14 Very good realism! Student 15 Very bad realism! Student 16 Student 17 Student 18 Student 19 Student 20 Complete: He ……….. a heart attack while he ……….. for the bus. 1. was having / was waiting 2. had / waited 3. had / was waiting 4. was having / waited S3 CD Student 1 Student 2 EARLI 11th Biennial conference 2005 - Development of edumetrical indices for the analysis of the spectral quality of higher education standardized tests – Jean-Luc Gilles
Turbo analysis principle and realism calculation for the Spectral Contrasted point biserial correlation (rpbSCT): Elimination of the data of each student who obtain a realism lower than 80... Student 3 Student 4 Student 5 Student 6 Student 7 …Calculation of the point biserial Spectral Contrasted correlation Student 8 Student 9 Student 10 Student 11 1 -1 0 Student 12 Student 13 Student 14 rpbSCT80 of « S3 » = 0,94 Student 15 Student 16 Student 17 Student 18 Student 19 Student 20 Turbo analysis = Increasing the reliability of information related to the spectral indices by restricting the data to the students who make less errors in their self-assessments S3 CD REALISM (Rs) Student 1 Student 2 EARLI 11th Biennial conference 2005 - Development of edumetrical indices for the analysis of the spectral quality of higher education standardized tests – Jean-Luc Gilles
Are these new spectral indices tested in full-size conditions? EARLI 11th Biennial conference 2005 - Development of edumetrical indices for the analysis of the spectral quality of higher education standardized tests – Jean-Luc Gilles
Full-size test We test these new Spectral Contrasted point biserial correlations indices with the data of several thousands of answers and confidence degrees collected during the ten standardized tests of the MOHICAN project supported by the French speaking community of Belgium. The aim of the MOHICAN project was to gather reliable data on the knowledge of the students entering university. (Leclercq & al, 2003) EARLI 11th Biennial conference 2005 - Development of edumetrical indices for the analysis of the spectral quality of higher education standardized tests – Jean-Luc Gilles
Item bank of the “MOHICAN” project : • Vocabulary (45) • Syntax and logical structuring of ideas (12) • Understanding of texts (6) • Reading of maps, graphics and tables in geography (10) • Mathematics (22) • Physics (10) • Chemistry (8) • Biology (10) • General knowledge in arts and culture (25) • General knowledge in History and Socio-economy (25) EARLI 11th Biennial conference 2005 - Development of edumetrical indices for the analysis of the spectral quality of higher education standardized tests – Jean-Luc Gilles
Population: • The academic institutions who participated: • the Catholic University of Louvain (UCL); • the Free University of Brussels (ULB), • the University of Liège (ULg); • the Academic Faculties Notre-Dame de la Paix in Namur; • the University of Mons-Hainaut (UMH); • the Catholic Academic Faculties of Mons (FUCAM); • the Saint-Louis Academic Faculties in Brussels (FUSL); • the Polytechnics Faculties of Mons (FPM) and the Agronomics • the Academic Faculties of Gembloux (FUSAG). EARLI 11th Biennial conference 2005 - Development of edumetrical indices for the analysis of the spectral quality of higher education standardized tests – Jean-Luc Gilles
Population: , EARLI 11th Biennial conference 2005 - Development of edumetrical indices for the analysis of the spectral quality of higher education standardized tests – Jean-Luc Gilles
What are the results of the full-size test of these new spectral indices? EARLI 11th Biennial conference 2005 - Development of edumetrical indices for the analysis of the spectral quality of higher education standardized tests – Jean-Luc Gilles
Full-size test results: The sizes of the populations at 10 turbo analysis levels 10 turbo analysis levels EARLI 11th Biennial conference 2005 - Development of edumetrical indices for the analysis of the spectral quality of higher education standardized tests – Jean-Luc Gilles
Full-size test results: Comparison of the rpb , rpbSC and rpbSCT80 values obtained by a particularly discriminating question EARLI 11th Biennial conference 2005 - Development of edumetrical indices for the analysis of the spectral quality of higher education standardized tests – Jean-Luc Gilles
Full-size test results: Comparison of the rpb , rpbSC and rpbSCT80 values obtained by a particularly problematic question EARLI 11th Biennial conference 2005 - Development of edumetrical indices for the analysis of the spectral quality of higher education standardized tests – Jean-Luc Gilles
Does spectral analysis better highlight the problems than the classical analysis? EARLI 11th Biennial conference 2005 - Development of edumetrical indices for the analysis of the spectral quality of higher education standardized tests – Jean-Luc Gilles
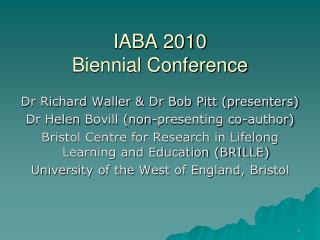
CONCLUSIONS: Concerning the DETECTION of the 5 MCQs highlighted by the experts: Classical correlation (rpb) Detects 2 problematic MCQs out of 5. New spectral correlation (rpb SC) Detectsall the 5 MCQs highlighted by the experts. New spectral correlation Detects 2 problematic MCQs out of 5. with turbo analysis (rpbSCT80) Concerning the FALSE ALARMS (detection of problem whereas the experts do not detect a particular anomaly): Classical correlation (rpb) Activates 10 false alarms. New spectral correlation (rpb SC) Activates 7 false alarms. New spectral correlation Activates 1 false alarm. with turbo analysis (rpbSCT80) Summary of the full-test results: • The 10 MOHICAN tests = 173 MCQs • 16 MCQs presents abnormal values for the classical and/or the spectral correlations • The experts point 5 MCQs with real problems EARLI 11th Biennial conference 2005 - Development of edumetrical indices for the analysis of the spectral quality of higher education standardized tests – Jean-Luc Gilles
CONCLUSIONS: From the point of view of « detection »: rpb SCismore effective Spectral analysis is « test free » 1 3 From the point of view of« lessfalsealarms »: rpbSCT80ismore effective rpbSCis more effective than the classical rpb 2 Classical analysis of discrimination: rpb Spectral analysis: rpb SC & rpb SCT Qualitativeanalysis:posterior opinions of the experts EARLI 11th Biennial conference 2005 - Development of edumetrical indices for the analysis of the spectral quality of higher education standardized tests – Jean-Luc Gilles
Thank you for your attention! For more information concerning the spectral quality analysis of standardized tests, do not hesitate to contact me: jl.gilles@ulg.ac.be http://www.smart.ulg.ac.be/earli-2005/spectral-analysis.ppt EARLI 11th Biennial conference 2005 - Development of edumetrical indices for the analysis of the spectral quality of higher education standardized tests – Jean-Luc Gilles