Download

1 / 20
200 likes | 351 Views
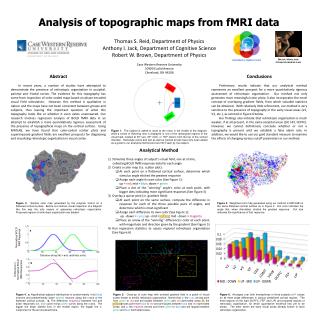
october 21st , 2007. Structural and Probabilistic Approaches in Group Analysis of fMRI Data. Brain and ICT workshop. Bertrand Thirion 1 , Alan Tucholka 2 , Philippe Pinel 3 , Jean-Baptiste Poline 2 1: INRIA Futurs, 2: CEA, Neurospin, 3:INSERM U562, Neurospin. Neurospin. IRM 7T.

E N D
october 21st, 2007 Structural and Probabilistic Approaches in Group Analysis of fMRI Data Brain and ICT workshop Bertrand Thirion1, Alan Tucholka2, Philippe Pinel3, Jean-Baptiste Poline2 1: INRIA Futurs, 2: CEA, Neurospin, 3:INSERM U562, Neurospin
Neurospin IRM 7T IRM 11.7T Neurospin LRMN LBIOM LCOGN LNAO INRIA@NS
Group Analysis in functional neuroimaging RFX statistic Activity maps of the subjects: β(s,v) for subject s, voxel v thresholding Thresholding is performed to control the rate of false detections. significance level α: threshold θ so that P(RFX> θ | H0)<α Under H0, assuming normal signal distribution RFX follows a student law with (S-1) degrees of freedom
Inter-subject variability Inter-subject variability is a prominent effect in neuroimaging Anatomically… …functionally
Problems with standard inference - Statistical: Small sample size, non-normal distribution - Localization: Normalization does not provide perfect correspondences - Model: voxel-based inference is not really adapted Partial solution: Consider the individual data and model the activation patterns Example: Localizer experiment :computation -sentence listening T100 7 3.3
The where ? question Which referential for the brain ? Talairach system Cytoarchitectonic maps (Zilles et al.) MNI average brain Approximated Brodmann (Mazoyer et al.) See Brett et al., Nature Neuroscience, 2002
Structural approaches in functional neuroimaging Our aim: Account for the common activated regions across subjects as well as for inter-subject differences, in spite of small-scale variability • Which structures should be extracted from the data ? • scale-space blobs [Poline:94, Coulon:00] • sparse GMM [Penny:03] • Activity peaks [Thirion:05] • Watershed, [Thirion:06, Davatzikos:O7] • Parcels [Flandin:04,Thirion05] • How to discriminate truly activated regions and false positives ? • - tests on signal/size [Poline:94] • - pseudo-posterior [Coulon:00] • - test on the spatial distribution [Thirion:06/07] • How to associate structures across subjects ? • - Global MRFs [Coulon:00] • - Pairwise comparison and groupwise-clustering [Thirion:06/07] Brain Functional Landmarks (Thirion: MICCAI’05) represent isolated regions with specific activity. It is however a very conservative approach
Pipeline input: individual activation maps Subject s Other subjects Blob extraction Mixture modelling nested ROIs ROIs + significance ROIs + significance Spatial Dirichlet Process Mixture Model Output: ROIs +posterior probabilities Selected ROIs pairwise correspondences between ROIs +Group-level positions Group-level correspondences between ROIs
Structural model: the blob φs structural model Simplified structural model activity map φs(v) in subject s m l l m m l k n n Notations: The regions will be denoted ajs j k j j 5 =2.2 0 Merge the small regions (e.g.<5voxels) into their father region
Assessment of the intra-subject cluster significance Discriminate the significance level of the regions based on the average signal φjs = mean φ(v) Problem : All the regions do not have the same likelihood of being truely active regions. v∈ajs Gamma-Gaussian Mixture Model: Provide an estimate of P(Hi| φjs),i=0,1 [woolrich:05]
Significance of the regions: Bayesian approach Probability of being an activated region given the signal Probability of the position of the region given its class Posterior Probability of being an activated region given the signal and the position Next point: Define the likelihood under both hypotheses
Inference procedure Individual data Group-level spatial model of activated regions p(t|H1) DPMM And validated individual ROIs
Searching for correspondences Subject s2 Subject s1 l k f(j) j k Bayesian Network Model l j f(j) Initilization: Probabilistic Evidence Inference: Belief propagation
Extracting maximal cliques from the correspondence graph Input : Belief matrix B = probabilistic correspondence graph Replicator dynamics Equations (Pelillo:95, Lohmann:02) The coordinates of x that do not vanish correspond to a maximal clique Initialize x(0) randomly or uniformly then update
Effect on the sensitivity of the analysis 10 subjects, what the voxels/regions with significant activity for the computation-understanding contrast ? RFX (p<0.001) uncorrected Cluster-level Mixed Effects (p<0.05) The proposed method Cluster-level RFX (p<0.05)
Effect on the reliability of the analysis The definition of the confidence regions for activated areas is more reliable than other activation detection methods. Puerly voxel-based methods have low performance Method : see Thirion et al., NeuroImage, 2007
Results: subject-based patterns Group template Individual data
Comparing subjects : unsupervised classification Larger cohort of 102 subjects: 55 regions found A relatively homogeneous population Computation of the average ROI-based signal and inter-subject comparison A few outliers
Comparing subjects : supervised methods Correlation of the signal with the ability to perform a mental rotation task Correlation of the signal with the sex
Introduction of a new structural approach for fMRI group inference Enable to discover correspondences across subjects Novel way to perform group inference/ group comparison More sensitivity, higher reliability Bayesian control of the sensitivity/specificity Conclusion • In the Future: • A more integrated and fully Bayesian framework (generative model) ? • Towards anatomo-functional atlases ? Many tanks to Alan Tucholka, Cécilia Damon, Merlin Keller, Philippe Pinel, Philippe Ciuciu, Alexis Roche, J.-F. Mangin and J.-B. Poline Implemented in nipy, available soon in Brainvisa software