Download
1 / 9
90 likes | 292 Views
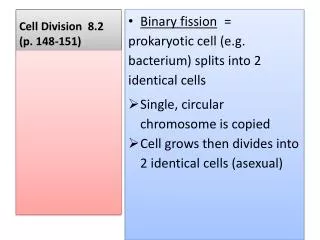
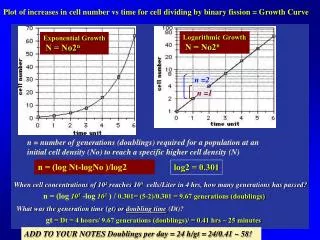
Logarithmic Growth N = No2 n. Exponential Growth N = No2 n. n = number of generations (doublings) required for a population at an initial cell density (No) to reach a specific higher cell density (N). n = (log Nt-logNo )/log2. log2 = 0.301.

E N D
Logarithmic Growth N = No2n Exponential Growth N = No2n n = number of generations (doublings) required for a population at an initial cell density (No) to reach a specific higher cell density (N) n = (log Nt-logNo )/log2 log2 = 0.301 Plot of increases in cell number vs time for cell dividing by binary fission = Growth Curve n =2 n =1 When cell concentrations of 102 reaches 105 cells/Liter in 4 hrs, how many generations has passed? n = (log 105 -log 102 ) / 0.301= (5-2)/0.301 = 9.67 generations (doublings) What was the generation time (gt) or doubling time (Dt)? gt = Dt = 4 hours/ 9.67 generations (doublings)/ = 0.41 hrs ~ 25 minutes ADD TO YOUR NOTES Doublings per day = 24 h/gt = 24/0.41 ~ 58!
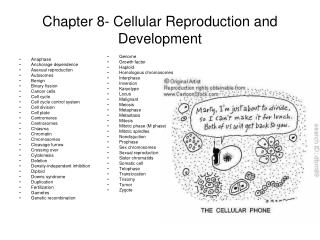
Compare pattern of growth based upon cell number vs biomass estimates over time NH4 urea NO3 control Lot Chl a concentration Log cell density max max min Under LD, cell division is often phased to one time of day, with gt varying in a repeatable (predictable) pattern over time • Here, in situ diatoms were incubated in collecction water plus one of 3 possible inorganic nitrogen sources were added. • Do results indicate that N is limiting in the original sample? • Which is the most limiting N source? • need control expt to see growth in absence of extra nutrients
Another way of estimating growth rate is to calculate the rate of change in cell number or mass per change unit time (dN/dt), esp. to identify phased & highly dynamic growth rates Exponential Growth dN/dt = mN Synchronous growth Nt1 Nto dN/dt = mN Where dN/dt = is the rate of change in cell number or mass per unit time&m=specific growth rate constant, usually expressed in values per day (D-1) To solve form for any specific time interval, the differential dN/dt must be integrated between times t1 &t2 lnNt2 - lnNt1 = m(t2-t1) Note: ln (natural exponential log) [lnNt2 - lnNt1]/ (t2-t1) = m units(d-1) m N • = ln 2/ n, where n = number of generations units(d-1)
Continuous culture system (chemostat, cyclostat, turbidostat) differ from batch cultures in that nutrients are supplied to the cell culture at a constant rate, and in order to maintain a constant volume, an equal volume of cell culture is removed. This allows the cell population to reach a “steady state” (ie. growth and cell division where the growth rate and the total number of cells per milliliter of culture remains constant). Pattern of diel variation in cell division of diatom grown in a cyclostat (chemostat with LD cycle) 1. If flow rate removes cells as fast as they divide, then the cell concentration in the chemostat will stay the same and its gt = time it takes to completely replace the volume of medium in the chemostat once. 2. However, cell concentrations in chemostat can rise when the actual gt is faster than the gt predicted by setting the flow rate. 3. And cell concentrations in chemostat will fall when the actual gt is predicted than the gt predicted by the set the flow rate.
4 diatom spp Fe concentration in growth media Growth rate is dependent upon many biological variables and comparison of growth rates under different conditions and between phytoplankton type show the great variability that any one variable may have on growth rate. What is the experimental set up to get this data using batch cultures ?
(k = m) Winter SST Different races of a single specie of phytoplankton havve developed at each pole as ocean warmed and separated the specie into isolated niches. Temperature Regulation of microbial growth rates
Falklands Atlantic temperature section Greenland
Non-halophile Halotolerant Halophile Extreme Halophile Salinity regulation of microbial growth…not the different shapes of the different curves • Extreme halophile…salt ponds • halophile… most marine phytoplankton • halotolerant…estuaries, coastal zone, ice edge • Non-halophile… freshwater, soil, gut (enteric) Surface salinityNote how muchSaltier the N. Atlantic is than N. Pacific Ocean
Review of the Carbon Cycle found in all types of aquatic ecosystems 2. Autotrophic Growth (formation of new organic C, N, P, S, Si etc. from external inorganic sources) 4 1 DOM 3. Grazing (consuming new POM, DOM ) and passing through food webs, microbial loops 5 3*. Grazing (consuming recycled POM, DOM ) and passing through microbial loops 6 inorganic 4. Create DOM pool due toexcretion sloppy feeding, death / decay 1. Inorganic NutrientUptake & Limited availability controls u 5. Uptake of DOM to support heterotrophic growth 6. Remineralization Fecal material 7. Sinking &/or Burying of POC in sediment / Plant Biomass /Animal Biomass /Bacterial Biomass