Download
1 / 12
120 likes | 350 Views
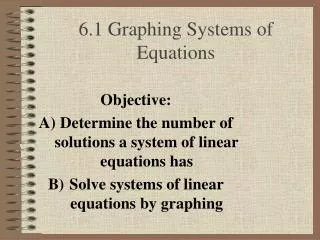
7.1 Graphing Systems of Equations. Objectives: Graph systems of equations. Solve a system of equations by inspecting a graph . Standards Addressed: 2.8.8.H: Graph a linear function from a rule or tables. 2.8.8.G: Represent relationships with graphs in the coordinate plane.

E N D
7.1 Graphing Systems of Equations Objectives: Graph systems of equations. Solve a system of equations by inspecting a graph. Standards Addressed: 2.8.8.H: Graph a linear function from a rule or tables. 2.8.8.G: Represent relationships with graphs in the coordinate plane.
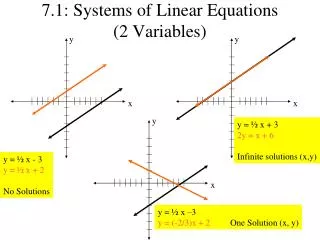
Two equations in two variables are called a system of equation. • A solution to a system of equations is an ordered pair of numbers that is a solution to each equation in the system. • The solution to a system of linear equations can be found by graphing.
It is sometime difficult to find an exact solution from a hand-drawn graph of a system of equations. • A reasonable estimate for a point of intersection is an approximate solution.
Ex. 3 Find an approximate solution by graphing. Check your answer.
Ex. 4 a. A bird club holds an annual photography contest among its members. After a set time limit in a particular park, contestants receive 4 points for photos of songbirds and 20 points for photos of birds of prey. Last year’s winner had a total of 200 points from 38 photos of individual birds. How many of each type of bird did the winner photograph? • 4x + 20y = 200 and x + y = 38 • Solve for slope intercept form: Y = -1/5x + 10 and y = -x + 38 Graph and find the point of intersection, which is (35 songbirds, 3 birds of prey)
b. Several books are on sale at a bookstore. Some of these books cost $3, while others cost $5. One day last week, 80 of these books were sold. The total amount of the sales was $300. How many of each type of book were sold? • 3x + 5y = 300 AND x + y = 80 • Solve for Slope Intercept Form: • Y = -3/5x + 60 AND y = -x + 80 • Graph and find the point of intersection, which is (50 three dollar books, 30 five dollar books)