Download
1 / 16
160 likes | 187 Views
Explore recent medication use trends in elderly population, including prevalence, patterns, and potential risks, offering insights for improved care and safety measures.

E N D
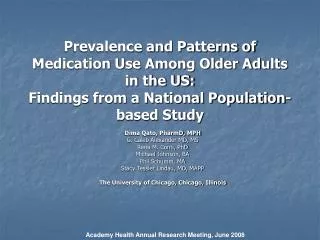
Prevalence and Patterns of Medication Use Among Older Adults in the US: Findings from a National Population-based Study Dima Qato, PharmD, MPH G. Caleb Alexander MD, MS Rena M. Conti, PhD Michael Johnson, BA Phil Schumm, MA Stacy Tessler Lindau, MD, MAPP The University of Chicago, Chicago, Illinois Academy Health Annual Research Meeting, June 2008
Objectives • Determine recent prevalence and patterns of medication use in the elderly • Assess medication-related quality of care
Background • 92% of elderly have a prescription drug expense. • 13% use Rx’s concurrently with alternative medicines • 21% use 5 or more Rx medications • Elderly increased risk for Adverse Drug Events (ADE). • ADE-related hospitalizations/ER visits most commonly due to GI bleeding • Increase inMedicare spending on Rx drugs (2% in 2005 to 18% in 2006) Kaiser Family Foundation, 2007; Catlin, et al, 2008; Kaufman et al 2002; Gardiner et al 2006; Becker et al, 2007; Budnitz et al, 2007
Limitations of available medication data sources • Claims/administrative data • Only patients with access to health care • Only prescribed/dispensed medications • Do not measure actual drug use (ingestion) • Do not focus on elderly (aggregate adults 65 and older) • Do not measure use of all types of medications. • Outdated (do not account for new medications that enter market)
Study Methods • Data: National, Social life, Health, and Aging Project (NSHAP)- Wave I (2005-2006) • In-home interview of 3,005 community-residing adults ages 57-85 • Nationally-representative population-based probability sample; minority over-sampling; response rate=75.5% • Weighted-estimates • Universe: Directly-observed Medication log • “medications currently used on a regular schedule, like every day or every week. Including prescription, OTC, vitamins, herbals and alternative medicines.” • Drug name matching rate=97% • Micromedex Interaction software
Prevalence of use Measures • Prescription medication use: use of at least one medication available only with a prescription. • Over-the-counter use: Use of non-prescription medication that is not a dietary supplement. • Dietary supplement use: use of a nutritional product or alternative medicine. Patterns of use Measures • Poly-pharmacy: use of 5+, 10+ Rx medications • Concurrent use: use of a Rx medication concurrently with a non-Rx medication • Quality of Care Measure • Major medication interaction: a drug-drug interaction of potentially • Major severity as defined by Micromedex® among users of the 20 most • common Rx and OTC drugs and 20 most common CAM therapies.
Rx and OTC Medications Commonly Used (≥ 5%) by Adults 65 and older (1999 vs.2005)
Most commonly used (≥ 3%) Dietary Supplements Among Adults 65 and older (1999 vs.2005)
Medication Interaction Severity Definitions • major:life-threatening and/or require medical intervention to minimize or prevent serious adverse events. • moderate: may result in the exacerbation of the patient’s condition. • minor:the interaction would have limited clinical effects.
Limitations • Cross sectional data • Comparability to previous studies • Micromedex® Interaction software • Major Interactions reported only for commonly used medications.
Conclusions • Overall increase in the prevalence of medication use and number of commonly used medications among older adults • Types of commonly used Rx, OTC, and dietary supplements varies over time • Poly-pharmacy is common and increases with age • Self-medication with NonRx is widespread across all older age groups • Approximately 2.2 million (4%) older adults in the U.S. are at risk for a harmful medication interaction • Half are potentially at risk for GI bleeding
Implications • Up-to-date data on medication use among older adults increasingly important in the assessment of medication-related Quality of care • National prescription data sources need to incorporate information on all types of medications • Efforts to minimize harmful interactions should focus on common medications with the highest risk and the oldest age group • Patient safety in older adults requires clinician awareness of current prescription medication and self-medication use patterns
Supported by: • The University of Chicago Program in Pharmaceutical Policy • Chicago Core on Biomeasures in Population-Based Health and Aging Research, Center on Demography and Economics of Aging, NORC and the University of Chicago (P30 AG 012857) • National Institute of Health and the National Institute on Aging, Office of Research on Women's Health Office of AIDS Research, and Office of Behavioral and Social Sciences Research (R01AG021487) Public use dataset available at: http://www.icpsr.umich.edu/NACDA