Download
1 / 39
400 likes | 533 Views
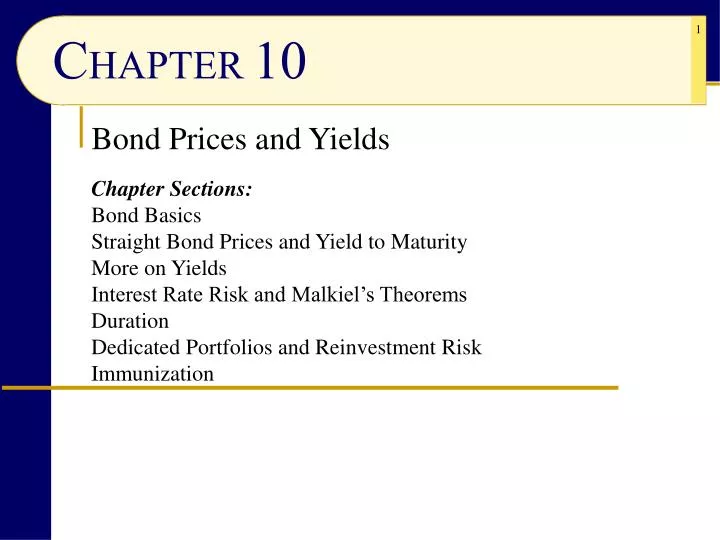
C HAPTER 10. Bond Prices and Yields. Chapter Sections: Bond Basics Straight Bond Prices and Yield to Maturity More on Yields Interest Rate Risk and Malkiel’s Theorems Duration Dedicated Portfolios and Reinvestment Risk Immunization. Bond Yields.

E N D
CHAPTER10 Bond Prices and Yields Chapter Sections: Bond Basics Straight Bond Prices and Yield to Maturity More on Yields Interest Rate Risk and Malkiel’s Theorems Duration Dedicated Portfolios and Reinvestment Risk Immunization
Bond Yields • Bond yield is one of the most important factors in bond valuation • What income is the bond paying? • Over the long sweep of time, income is what you receive from investing in bonds • Although there are sometimes opportunities for capital gains and sometimes risks of capital loss • But when the bond is redeemed, you are only going to get back the par value ($1,000) • Given that most all bonds repay their principal without incident, the valuations calculated using bond yields tend to be very predictable
Bond Yields (continued) • The unpredictable factor in bond valuation is the future direction of interest rates • However, for the many people who hold onto their bonds until maturity (until they get their principal back), the direction of interest rates is unimportant to them • They are mostly interested in the income and are not generally affected by the direction of interest rates since they have no intention of ever selling their bonds before they mature • You are only concerned about changing interest rates if you intend (or are forced) to sell your bonds before they mature
Types of Bond Yields • There are several types of bond yields • Nominal Yield (a.k.a. Coupon Yield, Nominal Rate) • The stated rate of the bond • Current Yield (a.k.a. Current Rate) • The interest rate of the bond given its current price • Yield-to-Maturity • The rate if you hold the bond until it matures • Yield-to-Call • The rate if you hold the bond until it is called • Taxable Equivalent Yield (Municipal bonds) • The rate taking into account no Federal income tax • Double Tax-free Taxable Equivalent Yield • The rate taking into account no Federal and no state income tax
Nominal Yield • Nominal Yield • a.k.a. Coupon Yield, Nominal Rate, Coupon Rate • The named interest rate of the bond • The bond’s annual interest income divided by its par value • What the bond is paying in absolute dollars Example: Par value $1,000, $80 interest per year Nominal Yield = $80 / $1,000 = 0.08 = 8%
But the Nominal Yield is not as important as… • Current Yield • The amount of current income a bond provides relative to its market price • Yield-to-Maturity • The fully compounded rate of return earned by an investor over the life of the bond • Includes current income and price appreciation or depreciation • a.k.a. Promised Yield • Yield-to-Call • The yield on a bond assuming it will be called on a specified date sometime in the future
Current Yield Annual Interest Current Yield = ──────────────────── Current Market Price of the Bond Example: 8% bond selling at $800 $80 Current Yield = ──── = 0.10 = 10% $800 The nominal yield is 8% but because the bond is selling at a discount, the current yield is actually 10%.
Current Yield (continued) Annual Interest Current Yield = ──────────────────── Current Market Price of the Bond Example: 8% bond selling at $1,200 $80 Current Yield = ──── = 0. 0666667 6.67% $1,200 The nominal yield is again 8%, but because the bond is selling at a premium, the current yield is only 6.67%.
Yield-to-Maturity • The Yield-to-Maturity takes into account the price appreciation of the bond if the bond is purchased at a discount • Or price depreciation of the bond if the bond is purchased at a premium • Two primary methods of calculation (there are others) • The bond pricing formula discussed later combined with an internal rate of return approximation • More accurate method but difficult to do manually • Remember the spreadsheets from chapter 6? • The YTM formula on the next slide • Looks scary but is actually fairly easy to use
Yield-to-Maturity (continued) Par value - Market value Number of years to maturity Par value + Market value 2 Example: 8% maturing in 10 years, price $800 $1,000 - $800 10 $1,000 + 800 2 = 0.111111 11.1% $ Amt Annual Interest + $80 +
Yield-to-Maturity (continued) Par value - Market value Number of years to maturity Par value + Market value 2 Example: 8% maturing in 10 years, price $1,200 $1,000 - $1,200 10 $1,000 + $1,200 2 = 0.054545 5.45% $ Amt Annual Interest + $80 +
Yield-to-Maturity (continued) • Wait a minute… • The current yield on our 8% discount bond selling at $800 was 10% • But the yield-to-maturity was 11.1% • And the current yield on our 8% premium bond selling for $1,200 was 6.67% • But the yield-to-maturity was 5.45% • How is that possible? What is going on? It is actually very straightforward. The discount bond was purchased at $800 but will be redeemed at $1,000. The premium bond was purchased at $1,200 but, again, will be redeemed at $1,000. The yield-to-maturity takes into account the bond appreciation from the discount price up to the par value or the depreciation from the premium price down to the par value.
Yield-to-Call • The Yield-to-Call takes into account the possibility of the bond being “called” • Only used on premium-priced bonds • (A bond issuer would never call in discount bonds. That would mean they would be refinancing at a higher rate) • Again, two methods of calculation (with some others) • The bond pricing formula discussed later combined with an internal rate of return approximation • More accurate method but difficult without a computer • The same formula as Yield-to-Maturity • But replace par value with call price and years-to-maturity with years-to-call
Yield-to-Call (continued) Call value - Market value Number of years to call Call value + Market value 2 8% call in 5 years, price $1,200, call price $1,085 $1,085 - $1,200 5 $1,085 + $1,200 2 = 0.049891 4.99% $ Amt Annual Interest + $80 +
Yield-to-Callvs Yield-to-Maturity (continued) • The yield-to-call was less than the yield-to-maturity • Yes, this is typical • This is because if the bonds are called away, we would have less time to take advantage of the outsized interest income payments
Taxable Equivalent Yields (review) • Taxable Equivalent Yields for Municipal Bonds • a.k.a. “tax-exempt yield” “tax-free yield” • Since municipal bonds are free from Federal taxes, in order to effectively compare municipal bonds to other bonds, we compute the taxable equivalent yields • Federal Taxable Equivalent Yield • For municipal bonds free of Federal income tax • Double Tax-free Taxable Equivalent Yield • For municipal bonds free of both Federal income tax and the investor’s state income tax • Example: California double tax-free bonds do not charge income to California resident investors
Taxable Equivalent Yields (continued) Taxable Equivalent Yield = Municipal Bond Yield 1.0 – (Your marginal tax rate) Example: 6% Yield, 25% Tax bracket Taxable equivalent yield = 0.06 1.0 - 0.25 = 0.08 = 8%
Taxable Equivalent Yields (continued) • Taxable Equivalent Yield for Both Federal & State – a.k.a. “double tax-exempt” “double tax-free” • The formula on the previous slide only takes into account Federal income taxes • If the municipal bond is free of both Federal and State income taxes (“double tax-free”), then the Taxable Equivalent Yield will be higher • The formula on the next slide assumes that you itemize deductions on your Federal income taxes and deduct State income taxes • Which is very typical for municipal bond investors • If you don’t itemize deductions, then the Taxable Equivalent Yield would be a bit higher
Taxable Equivalent Yields (continued) Taxable Equivalent Yield for both Fed & State = Municipal Bond Yield 1.0 – [ Fed rate + State rate * (1 – Fed rate)] Example: 6% Yield, 25% Fed rate, 8% State rate Taxable equivalent yield = 0.06 1.0 – [0.25 + 0.08*(1-0.25)] = 0.086957 8.7%
Yield Spreads • Differences in interest rates that exist among various sectors of the bond market • The shorter the maturity, the lower the rate • The longer the maturity, the higher the rate • The higher the rating of the bond, the lower the interest rate (and vice versa) • Treasuries carry the lowest rates • Municipal bonds are next • General obligation bonds • Revenue bonds • Corporate bonds yield the highest rates • Non-callable • Callable
Yield Spreads (continued) Let’s look at the current yield spreads on Yahoo! http://finance.yahoo.com/bonds/composite_bond_rates
Yield Spreads (continued) • Often, investors will speak about the bond spreads as being “tight” or “wide” • A “tight” spread means the interest rates among the bonds they are evaluating are very close to one another • Example: Treasury paying 4.8%, Corporate bond paying 5.1% • A “wide” spread means there is a big difference between the bond interest rates • Example: Treasury paying 3.2%, Corporate bond paying 8.2% For several years, bond yield spreads were very tight. During the turmoil of 2008 and 2009, the yield spreads widened to levels not seen in decades. They have narrowed significantly over the past few years.
The Effect of Inflation on Bond Rates Source: Department of Labor Statistics
The Yield Curve • A graph that represents the relationship between a bond’s maturity and its yield at a given point in time • Also used to make comparisons among types of bonds • Normally, the yield curve is upward sloping • Longer term bonds have higher interest rates than shorter term bonds and bills • Sometimes, the yield curve is downward sloping (a.k.a. “inverted yield curve”) • Shorter term bonds and bills have higher interest rates than longer term bonds
The Yield Curve (continued)
The Yield Curve (continued) Source: Yahoo!, March 16, 2012
Theories re: Yield Curves • Why do longer term debt securities normally have higher interest rates than shorter term debt securities? • Expectations Hypothesis • The shape of the yield curve reflects investors’ expectations of future interest rates • Maturity Preference Hypothesis • a.k.a. Liquidity Preference Hypothesis • Investors tend to prefer the liquidity of short-term securities and, therefore, require a premium to invest in long-term securities
Theories re: Yield Curves (continued) • Market Segmentation Hypothesis • The market for debt is segmented on the basis of maturity. Supply and demand within each segment determines the prevailing interest rate. Each of these 3 theories makes sense and each has some merit. But how do we account for the times when the yield curve is inverted? What factors could cause an inverted yield curve to occur? And what can the yield curve tell us about the future of the economy?
The Yield Curve & the Economy • Since World War II, every time the yield curve has inverted (short term rates were higher than long term rates), the economy has fallen into a recession • The only exception was 1966 • The yield curve is currently mostly upward • But for about two years before the beginning of 2008, the yield curve had been inverted! The bond market had been predicting a recession for over two years. The stock market, for the most part, didn’t believe them. It wasn’t until fall of 2008 that the officials charged with tracking the economy acknowledged that we were in a recession. It took over two years, but the bond “ghouls” were finally proven right.
Bond Pricing • Bonds are normally priced according to the present value of their future cash flows • Semi-annual interest payments, and • Repayment of principal • Although other factors will always need to be considered • Such as the credit-worthiness of the issuer • If an issuer runs into trouble, the price of their outstanding bonds will fall because investors will be afraid of default
Bond Pricing (continued) • Bond price = present value of the interest income + present value of the repayment • Look familiar? It’s the Dividends & Earnings Model! • Annual versus semi-annual compounding • Since bonds pay interest normally every six months, we really should use semi-annual compounding • However, annual compounding is easier to compute and will give you almost the exact same answer • Computations are easily done using the present value tables • Spreadsheets make it even easier
Bond Pricing (continued) • Example: Republic Services • 5.0%, due 1-Mar-2020, priced to yield 4.09% • Yield-to-Maturity 4.09%, Current Yield 4.687% • 4.09% is close to 4% – Let’s use 4% for 8 years Bond price = present value of the interest income + present value of the repayment = $50.00 * 6.733 (present value factor for stream of income) + $1,000 * 0.731 (present value factor for repayment of bond) + = $336.65 + $731.00 = $1,067.65 The quoted price on Yahoo! on Mar 16th was $1,066.90. However, we are using 4% instead of 4.09% plus the maturity is slightly less than 8 years. Also, we are yearly interest payments and bonds actually pay semi-annually. The more accurate bond calculator spreadsheet gives us $1,060.74 for annual payments and $1,063.57 for semi-annual payments.
Reinvestment Risk • The uncertainty about the future value of an investor’s bond investments that result from the need to reinvest bond interest payments and redemptions at yields not known in advance Changing interest rates don’t only affect the price of your bonds. They also affect your future income as you need to reinvest the interest income and bond repayments. If interest rates have fallen, your income level will fall as you reinvest your income and bond repayments. Likewise, if interest rates have risen, your income level will rise.
Duration • Measure of a bond price’s sensitivity to changes in interest rates and bond yields • Captures both price and reinvestment risk • Used to indicate how a bond will react in different interest rate environments • The duration of a bond changes as it approaches its maturity date and current interest rates change • In general… • The longer a bond’s maturity, the longer its duration • The higher a bond’s nominal rate and yield-to-maturity, the shorter its duration The shorter the duration, the less potential price volatility, and vice-versa.
Duration and Immunization • Investors who have a specified time horizon can use “bond immunization” to increase the probability of successfully achieving their desired goal • Keep the average duration of your bond investments equal to your time horizon • You would thus be more protected against interest-rate induced price swings • Requires constant rebalancing of your bond portfolio since durations of bonds change as interest rates change and bonds get closer to maturity Mostly used by pension fund & bond mutual fund managers.
Bond Investment Strategies • Income Strategy • Purchase the bonds simply for the interest income they produce • Capital Gains Strategy • Speculating that interest rates will fall • Total Return • Purchasing bonds for both the income and the possibility of capital gains Which of these would be the easiest to implement? Which would be the hardest?
Bond Investment Strategies (continued) • Bond Laddering • Strategy of purchasing bonds with staggering maturities • Purchase some bonds with short-term maturities, some with intermediate-term maturities and some with long-term maturities • Again, very popular strategy with pension fund and bond mutual fund managers • Since they have considerable sums of money to invest What are the advantages and disadvantages of this strategy? When is it a good time to ladder? When is it not a good time?
Bond Investment Strategies (continued) As of 16 March 2012
CHAPTER10 – REVIEW Bond Prices and Yields Chapter Sections: Bond Basics Straight Bond Prices and Yield to Maturity More on Yields Interest Rate Risk and Malkiel’s Theorems Duration Dedicated Portfolios and Reinvestment Risk Immunization Next: Preferred Stocks & Convertible Securities, Chapter 11, Asset Allocation