Download
1 / 23
240 likes | 501 Views
Imagining the Future of Agriculture. Robert Tse USDA Rural Development Yribarren Ranch Bishop , CA July 24, 2014. Global Demographic Drivers Global Ag Challenges Global Ag Opportunities. Global Demand Drivers to 2050. Global Population Increase Rapid Urbanization Growing Middle Class

E N D
Imagining the Future of Agriculture Robert Tse USDA Rural Development Yribarren Ranch Bishop, CA July 24, 2014
Global Demographic DriversGlobal Ag ChallengesGlobal Ag Opportunities
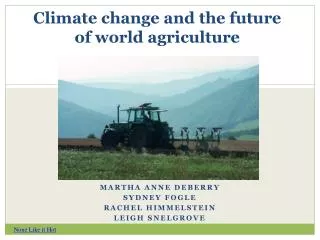
Global Demand Drivers to 2050 • Global Population Increase • Rapid Urbanization • Growing Middle Class • Climate Change Impact • Rising Food Prices • Rising Global Trade of Food • Rising Demand for Protein, Fruits and Vegetables • Agriculture Adapts to Climate Change • Rising Global Travel
Global Agriculture Challenges • Limited availability of more arable land for production without high environmental costs • Double Productivity on farm land already in production • Adapt to Global Climate Change • Meet Local Challenges
Global Agriculture Opportunities • Produce More with Less Labor • New Plant Hybrids, and Animal Breeds • New Agricultural Technology • New Agricultural Production Practices • Greater Efficiency in Agricultural Utilization of Water • Expanding Markets for California’s Food and Agriculture Products
Central Valley Produces More Than Any Other State- Except California $34.7 B $33.8 B $47.5 B $27 B Gross Farm Gate USDA NASS
2011 San Joaquin Valley Dominates California Ag Production 59% 2011 USDA NASS CA Gross Value
Inyo & Mono County Farm Gate $77.3 MillionAnimal Agriculture Dominates USDA NASS 2012
Local Impact Disruptive Events
2014 Drought Impact • Greatest absolute reduction in water available … for California agriculture ever seen … • State wide Impact: • Crop Revenue Loss: $810 Million • Additional Pumping Cost $454 Million • Livestock / Dairy Revenue Loss $203 Million • TOTAL DIRECT LOSSES $1.5 BILLION • TOTAL ECONOMIC COST: $2.2 BILLION • TOTAL JOB LOSSES: 17,000 Economic Analysis of the 2014 Drought for California Agriculture UC Davis Center for Watershed Sciences July 15, 2014
Disruptive Event: Digital 395
Agriculture Technology Combines two California core strengths: Agriculture and Technology Robert Tse USDA RD CA
FOUNDATION FOR ECONOMIC GROWTH AND OPPORTUNITY InfrastructureBROADBAND
Technology is Here! http://www.youtube.com/watch?v=q8dBOGAfUIk
Travel – Tourism is Critical to Rural Counties California Tourism Commission
Regional Economy Driven by Tourism $ Million $195 $136 $77 2012 2012 2011 2012 Source: California Tourism Commission, USDA - NASS
2011 San Joaquin Valley Dominates California Ag Production 59% 2011 USDA NASS CA Gross Value