Download
1 / 26
260 likes | 356 Views
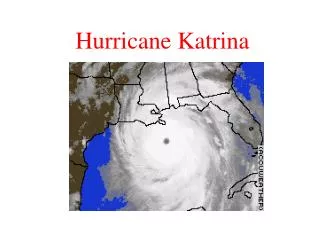
Communication of Hurricane Storm Surge Threat: A Mixed-Method Analysis. Kathleen Sherman-Morris, Karla B. Antonelli , Carrick C. Williams, Amanda Lea. Purpose. Many graphic styles used to communicate weather information. Little research has been done on understanding

E N D
Communication of Hurricane Storm Surge Threat: A Mixed-Method Analysis Kathleen Sherman-Morris, Karla B. Antonelli, Carrick C. Williams, Amanda Lea
Purpose • Many graphic styles used to communicate weather information. • Little research has been done on understanding • Test effectiveness of storm surge graphics as a function of color palette and legend type.
Two Methods • Eye tracking experiment • MSU Eye tracking lab • Participants included Student and General Public • Online survey of Mississippi and Alabama Gulf Coast residents • SurveyMonkey • Email-mailout from InfoUSA, supplemented by publicity from local TV meteorologist • Targeted Harrison and Jackson Counties in MS, Mobile and Baldwin Counties in Alabama.
What does eye-tracking add? • A real-time, online measure of behavior • Eye movements can be seen as a stand-in for attention • Measures of where and how long looking at stimuli can measure interest, effort to process
Apparatus • ISCAN ETL-400 • Uses a camera, infrared light shone into subject’s right eye • Camera records reflection from cornea (CR) and the lack of reflection from pupil • Calibrates these angles with computer display to determine where subject is looking • Chin rest used for head stabilization
Participants • 40 participants • Recruited from MSU meteorology program, MSU general student body, and Starkville community • 21 male, 19 female • Aged 19 to 55 years
Eye Tracking Procedure • Within subjects design with 5 levels • 3 color palettes • 2 legends (feet and text) • Order and location were varied for familiarity effects • 8 questions for each image (4 accuracy, 2 behavioral, 1 risk perception rating and 1 helpfulness rating)
Image Conditions--Green/Red ** No legend on 1st image
Which does the BEST job of informing the public about their storm surge risk?
Eye Tracking Results • Blue had longest response time • Text references had somewhat shorter response times than feet • Green/red produced most accurate* results, but accuracy was high for all palettes • People thought the green/red palette was the best, but did not prefer one legend type over the other * Not significant in most cases
Online Survey, briefly • 129 responses from Alabama counties • Average age 55 (range 19-84) • 40% women, 43% men, 7% no response • 76% White • 78% homeowners
Scenarios • Same color palettes/legends • One stronger storm, one weaker storm • 8 risk perception questions, 1 accuracy question, 1 intended behavior, 1 perceived helpfulness
Online Survey Results • No significant differences in risk perception among palettes and legends • Legend values in feet led to marginally less accuracy than text • Green/Red more accurate than Blue combined with Yellow/Purple • Could this be a legend effect? • More responses are necessary for further evaluation
Acknowledgements • This project was funded by NOAA, through the Northern Gulf Institute. The authors also thank Ethan Gibney, for creating the storm surge images.