Download
1 / 29
290 likes | 492 Views
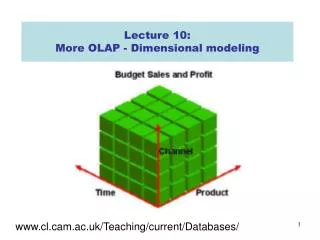
Introduction to OLAP and Dimensional Modelling. Tuesday. Overview: Tuesday. Format Time Description Lecture 10:00 - 10:45 Introduction to OLAP and Analysis Services Demo 10:45 - 11:30 Dimensional modelling

E N D
Overview: Tuesday Format Time Description Lecture 10:00 - 10:45 Introduction to OLAP and Analysis Services Demo 10:45 - 11:30 Dimensional modelling Lab 12:15 - 13:00 Practical session: Defining a data source and defining and deploying a cube Lab 13:00 - 13:45 Practical session: Modifying measures, attributes and hierarchies Lecture 14:30 - 15:15 Observations about design for OLAP and Reporting Discussion 15:15 - 16:00 Wrap-up: questions and feedback
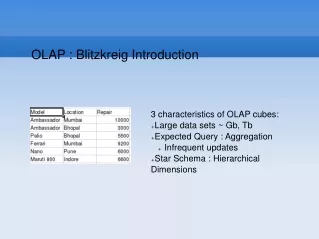
Definition of OLAP • Fast Analysis of Shared Multidimensional Information (‘FASMI’, Nigel Pendse) • Fast • Analysis (statistical and business logic) • Shared • Multidimensional • Information (all of the data and derived information needed)
Multidimensional • “The system must provide a multidimensional conceptual view of the data, including full support for hierarchies and multiple hierarchies, as this is certainly the most logical way to analyze businesses and organizations.”
Alternative definition of OLAP (from SAS) • OLAP is "fast access to large amounts of summarized data". • This implies the concept of dimensionality. For without dimensions, there would be nothing to summarize the data by. • Alternative definition is that OLAP provides: "the ability of users to conveniently interrogate large amounts of data, at varying levels of detail, across a variety of combinations of business dimensions"
Kimball’s Four-Step Design Process • Select a business process • Declare the grain • Choose dimensions • Identify facts
STEP 1: Select a business process • For our exercise, we will be looking at Internet sales
A Quick Look at the Data (1) USE AdventureWorksDW; SELECT TOP 5 CustomerKey, ProductKey, OrderDateKey, OrderQuantity FROM FactInternetSales
A Quick Look at the Data (2) Customer Product OrderDate SalesAmount Key Key Key ----------- ---------- ------------ --------------------- 11003 346 1 3399.99 14501 336 1 699.0982 21768 310 1 3578.27 25863 346 1 3399.99 28389 346 1 3399.99
STEP 2: Declare the grain • (What does a row in the fact table mean?) • In our example, a row is an individual order. • Design “rule”: recognise the trade-off. • A finer grain facilitates more detailed analysis, but results in a larger quantity of data.
STEP 3: Choose dimensions • DimCustomer • DimGeography • DimProduct • DimTime
STEP 4: Identify facts • The numeric facts that we will measure • FactInternetSales
Demo • Dimensional modelling
Lab • Defining a data source view • Defining and deploying a cube
Lab • Practical session: Modifying measures, attributes and hierarchies
The BI Bottleneck (1) • Report consumers • The report may be electronic, e.g. Excel • Power users • Capable of some self-service • Report authors • The know the data and the business. • Reporting administrator • They know the database and the data, but not necessarily how it relates to the business. • Challenge: make reporting more interactive so that changes can be accommodated without passing along the chain
The BI bottleneck (2) • Typically, analyst’s time is the scarce resource. • The number of iterations is the killer. • Sometimes, testing is the bottleneck. • Possible solution: the analyst spends a bit more time in the first iteration providing the business user with a more generic/interactive report.
The BI Bottleneck (3) • Long lead times • High development costs • Apparently small changes to a requirement for a report take a long time to implement. • For each link along the chain that a request for a change needs to go, delay goes up by a big factor.
The Relational Model of Data • Conceptually, homogeneous tabular structure: • Logic: for declarative query language • Algebra: for query optimization • Application interface (e.g. simple reporting tools). • Applications designers and even some end-users can (just about) understand tables. • Relational model provided a mutually intelligible language for implementers, administrators, developers, researchers and even users. • Flexible: join anything with anything (c.f. OLAP).
Inadequacy of the Relational Model for Reporting applications • Heterogeneous data sources: • Database, OLAP, XML Web services, etc. • Relational model does not fit well with the area between storage and presentation. • Aggregation hierarchies • Matrix structures
The Microsoft approach: UDM • Server Analysis Services 2005 implements UDM. • Acts as a bridge between users and their data. • Encapsulates semantics, language and time. • UDM ‘perspectives’ allow the user to view subsets. • Integrated with Data Mining. • Accessed via SOAP and XML for Analysis.
UDM • A UDM provides a single dimensional model for all OLAP analysis and relational reporting needs. So you can use either MDX or SQL • Perspectives are the new data marts • Cubes are largely transparent concepts downgraded to the status of caches • Commonly you’ll only have 1 cube with multiple measure groups and multiple perspectives. • Its better to think of measure groups instead of cubes; partitions now apply to measure groups. • Whilst a UDM can gather data from numerous data sources, the need to cleanse data still requires a data warehouse. • A cube is structured around dimensional attributes (previously known as member properties) rather than dimensional hierarchies. Hence the virtual dimension, as a term, is now gone and concept converted to a real, first class, dimension. • UDM has five new dimension types, Role Playing, Fact, Reference, Data Mining and Many to many.
Pre-UDM stack Dimension model (pivot table) Calculations (Excel) End-user model (if you are lucky) Data source view Management settings UDM stack Management settings End-user model Calculations Dimensional model Data source view The pre-UDM and UDM stacks
XML Web Service OLAP Browser (1) MOLAP OLAP Browser (2) UDM Datamart Reporting Tool (1) Datamart Reporting Tool (1) DW BI Applications Enterprise BI with UDM
Desirable features of a BI data model • The model must facilitate • re-use of report spare-parts by the power users (rather than just the report authors). • more flexibility for report consumers • easier maintenance of the set of all reports used by an enterprise. (E.g. Avoiding the reporting chain.) • Interaction.
Current design principles • All about how to make reports look good. • See, for example, Microsoft SQL Server 2005 Report Design: Best Practices and Guidelines • Some focus on maintenance. • No focus on re-use.
Wrap-Up • Questions • Feedback