Does this question result in a bernoulli trial?
260 likes | 406 Views
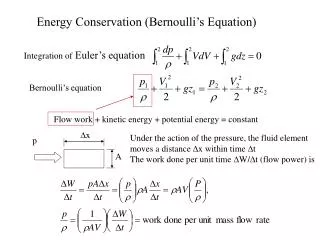
Does this question result in a bernoulli trial?. Yes No Who was Bernoulli again?. Bernoulli, Geometric, Binomial. Bernoulli – single trial Geometric – number of trials until success Binomial – number of success in n trials Poisson – number of success with large n and very small p.

Does this question result in a bernoulli trial?
E N D
Presentation Transcript
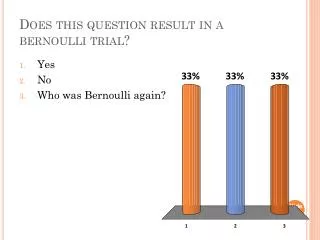
Does this question result in a bernoulli trial? • Yes • No • Who was Bernoulli again?
Bernoulli, Geometric, Binomial • Bernoulli – single trial • Geometric – number of trials until success • Binomial – number of success in n trials • Poisson – number of success with large n and very small p
Geometric probability model for Bernoulli trials: Geom(p) p = probability of success q = 1 – p = probability of failure X = number of trials until the first success occurs P(X = x) = qx-1p The Geometric Model (cont.)
Binomial probability model for Bernoulli trials: Binom(n,p) n = number of trials p = probability of success q = 1 – p = probability of failure X = number of successes in n trials The Binomial Model (cont.)
The Normal Model to the Rescue! • When dealing with a large number of trials in a Binomial situation, making direct calculations of the probabilities becomes tedious (or outright impossible). • Fortunately, the Normal model comes to the rescue…
The Normal Model to the Rescue (cont.) • As long as the Success/Failure Condition holds, we can use the Normal model to approximate Binomial probabilities. • Success/failure condition: A Binomial model is approximately Normal if we expect at least 10 successes and 10 failures: np ≥ 10 and nq ≥ 10.
Continuous Random Variables • When we use the Normal model to approximate the Binomial model, we are using a continuous random variable to approximate a discrete random variable. • So, when we use the Normal model, we no longer calculate the probability that the random variable equals a particular value, but only that it lies between two values.
Applying the normal model • A lecture hall has 190 seats with folding arm tablets, 25 of which are designed for left-handers. • The average size of classes that meet there is 177. • We can assume that about 12% of students are left-handed. • What’s the probability that a right-handed student in one of these classes is forced to use a lefty arm tablet?
Can we use the Normal Model? • Yes, n*p ≥ 10 and n*(1-p) ≥ 10 and we are examining a range of possible outcomes. • Yes, n*p ≥ 10 and n*(1-p) ≥ 10 and we are examining one possible outcome. • No, n*p ≥ 10 and n*(1-p) ≥ 10 and we are examining a range of possible outcomes. • No, n*p ≥ 10 and n*(1-p) ≥ 10 and we are examining one possible outcome.
What is the expected number of right handed students in the average class? • 177*(.12) • 177*(.88) • 190*(.12) • 190*(.88)
What is the standard deviation of right handed students in the average class? • 177*(.12)*(.88) • sqrt(177*(.12)*(.88)) • 190*(.12)*(.88) • sqrt(190*(.12)*(.88))
What has to happen for a right-handed student to have to sit in a lefty chair? • X ≥ 190 • X<190 • X ≥ 166 • X<166
What’s the probability that a right-handed student has to sit in a chair with a left-handed tablet? • .0089 • .9911 • .0166 • .9834
Process • Determine X • Check Normality Assumptions • Find E(X) and SD(X) based on the Binomial model • Determine z-score based on a fixed level or fixed standard given by the problem. • Apply to z-tables to find probability
Using statistics to test the validity of claims. • A newly hired telemarketer is told he will probably make a sale on about 12% of his phone calls. • The first week he called 300 people, but only made 12 sales. • Should he suspect he was misled about the true success rate? Explain.
Should he suspect he was misled? • Twelve sales is less than 1 SD below the mean. He was probably misled. • Twelve sales is less than 1 SD below the mean. He was probably NOT misled. • Twelve sales is less than 5 SD below the mean. He was probably NOT misled. • Twelve sales is more than 3 SD below the mean. He was probably misled.
The Poisson Model • The Poisson probability model was originally derived to approximate the Binomial model when the probability of success, p, is very small and the number of trials, n, is very large. • The parameter for the Poisson model is λ. To approximate a Binomial model with a Poisson model, just make their means match: λ = np.
The Poisson Model (cont.) Poisson probability model for successes: Poisson(λ) λ = mean number of successes or n*p X = number of successes e is an important mathematical constant (approximately 2.71828)
Applying the Poisson Model • The probability of contracting a disease is small, with p about 0.0005 for a new case in a given year. • In a town of 6,000 people, what is the expected number of new cases?
What is the expected number of new cases in a town of 6,000? • 6,000*0.0005 • 6,000*0.9995 • 6,000*0.0005*0.9995 • We need more information.
Use the poisson model to approximate the probability that there will be at least one new case of the disease next year • Exp(-3)*31/1! • Exp(-3)*30/0! • 1-Exp(-3)*31/1! • 1-Exp(-3)*30/0!
What’s the probability that there will be more than ten new cases next year? • Exp(-3)*310/10! • 0.9901 • 1-Exp(-3)*310/10! • 1-0.9901
Applying the Poisson Model • Hurricanes in a particular place arrive with a mean of 2.35 per year. • Suppose the number of hurricanes can be modeled by a Poisson distribution with this mean.
What’s the probability of no hurricanes next year? • Exp(2.35)*2.35 • Exp(-2.35)*2.35 • Exp(2.35)*2.350 • Exp(-2.35)*2.350
What’s the probability that during the next TWO years, there is exactly one hurricane? • Exp(-2.35)*2.35 • Exp(-2.35)*2.350 • Exp(-2.35)*2.35*Exp(-2.35)*2.350 • Exp(-2.35)*2.35*Exp(-2.35)*2.350+Exp(-2.35)*2.35*Exp(-2.35)*2.350
Upcoming • Homework 7 due Sunday • Review for Exam on Tuesday • Exam 1 on Thursday