Download
1 / 14
140 likes | 272 Views
This lesson delves into the fascinating world of nonlinear functions, focusing on polynomials and their properties. We explore the general formula of polynomials, identifying constant coefficients and their degrees, while learning to analyze their graphs in standard form. Key concepts such as local maxima, minima, and absolute extrema are introduced with practical examples, including applications like U.S. birthrate and natural gas consumption models. The lesson also covers symmetry in functions, helping students to visualize and comprehend the graphing behavior of even and odd functions.

E N D
Nonlinear Functions and their Graphs Lesson 4.1
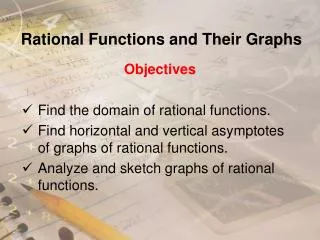
Polynomials • General formula • a0, a1, … ,an are constant coefficients • n is the degree of the polynomial • Standard form is for descending powers of x • anxn is said to be the “leading term”
• • Extrema of Nonlinear Functions • Given the function for the Y= screeny1(x) = 0.1(x3 – 9x2) • Use window -10 < x < 10 and -20 < y < 20 • Note the "top of the hill" and the"bottom of thevalley" • These are localextrema
• • Extrema of Nonlinear Functions • Local maximum • f(c) ≥ f(x) whenx is near c • Local minimum • f(n) ≤ f(x) whenx is near n c n
Extrema of Nonlinear Functions • Absolute minimum • f(c) ≤ f(x) for all xin the domain of f • Absolute maximum • f(c) ≥ f(x) for all xin the domain of f • Draw a function with an absolute maximum •
Extrema of Nonlinear Functions • The calculator can find maximums and minimums • When viewing the graph, use the F5 key pulldown menu • Choose Maximum or Minimum • Specify the upper and lower bound for x (the "near") Note results
Try It Out • Find local extrema … absolute extrema
Assignment • Lesson 4.1A • Page 256 • Exercises 1 – 45 odd
Even and Odd Functions • If f(x) = f(-x) the graph is symmetric across the y-axis • It is also an even function
Even and Odd Functions • If f(x) = -f(x) the graph is symmetric across the x-axis • But ... is it a function ??
Even and Odd Functions • A graph can be symmetric about a point • Called point symmetry • If f(-x) = -f(x) it is symmetric about the origin • Also an odd function
Applications • Consider the U.S. birthrate from 1900 to 2005(births per 1000 people) • Can be modeled by where x = number of years since 1900 • Evaluate f(95) • What does it mean? • With domain 1900 ≤ x ≤ 2005 • Identify the absolute minimum and maximum
Applications • U.S. natural gas consumption from 1965 to 1980 can be modeled by • x = 6 is 1966 and x = 20 is 1980 • Consumption measured in trillion cubic feet • Evaluate f(10) …. What does it mean? • Graph for 6 ≤ x ≤ 20 and 0.4 ≤ y ≤ 0.8 • Determine local extrema, interpret results
Assignment • Lesson 4.1B • Page 258 • Exercises 91 – 97 odd