Download
1 / 12
120 likes | 203 Views
Understory Growth Dynamics following High Severity Burn in a Mixed-Conifer Forest. Daniel Wilcox, Space Grant Intern Dr. Shirley A. Papuga, Faculty Advisor Dr. Tyson Swetnam , Mentor School of Natural Resources and the Environment University of Arizona

E N D
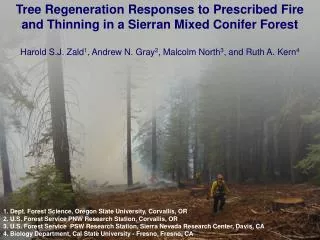
Understory Growth Dynamics following High Severity Burn in a Mixed-Conifer Forest Daniel Wilcox, Space Grant Intern Dr. Shirley A. Papuga, Faculty Advisor Dr. Tyson Swetnam, Mentor School of Natural Resources and the Environment University of Arizona 23nd Annual Arizona Space Grant Consortium Symposium April 12th, 2014
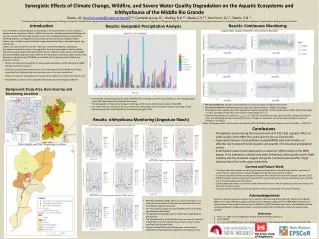
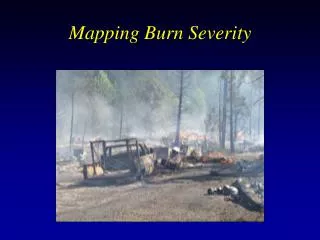
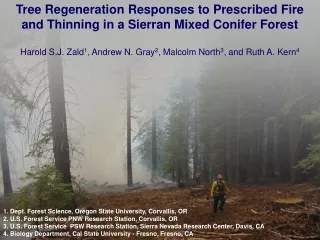
Big Picture In recent years, rampant wildfire in forests has become increasingly prevalent Forests provide important ecosystem services, such as carbon uptake and regulation of both water and erosion. Therefore understanding the dynamics of how they recover will become increasingly important. Credit: www.huffingtonpost.com
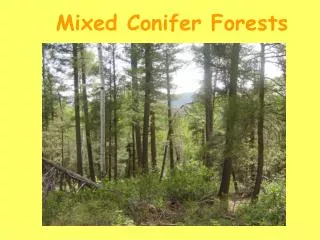
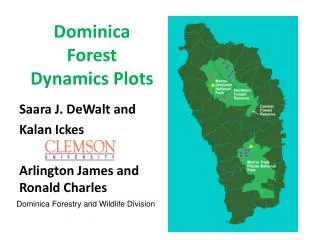
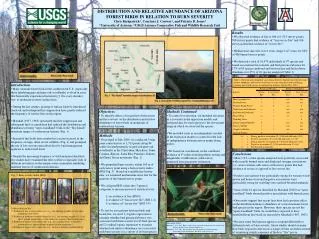
Study Area Spring 2014 Map Credit: Matej Durcik • Two adjacent mixed-conifer watersheds impacted by the 2011 Las Conchas Fire, Jemez Mountains, NM • Elevation: 2664 m – 2934 m • Annual Precipitation: 670 mm
Methods • Meteorological stations at the top and bottom of the watershed measured ecohydrological variables such as precipitation and air temperature every 30 minutes • Sensors in soil pits took measurements of soil temperature and soil moisture at three different depths every 10 minutes
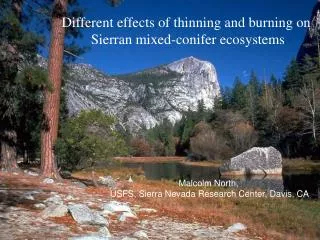
Methods • 10 “phenocams” were installed at different elevations and aspects (slope directions) • cameras took hourly images for one year post-fire • Cameras allowed observation of vegetation at any desired time throughout the year • From the images, a total greenness index was calculated based on the RGB values of the pixels: Early Season (June) Aspen Late Season (Oct) (Richardson et al 2007) http://youtu.be/iTe5oj8rqHA
Methods • 4 Terrestrial LiDAR Scans • LiDAR: Sweep a laser over an area to get a 2D mesh of distances. Combining multiple scans gives a 3D point cloud. • Point clouds were visualized and analyzed using CloudCompare software. • Comparing two scans at different times allows visualization of all the changes in the landscape An aspen seedling in the point cloud Data collected by Caitlin Orem, Jon Pelletier (UA Geology).
Results • The cameras show that vegetation understory growth was not uniformacross the watershed. • Aspens were seen in all sites except the two higher-elevation east-facing ones.
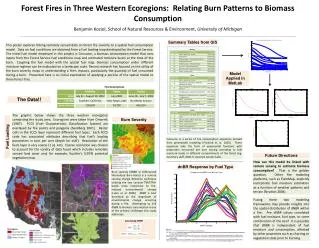
Results East Facing – High Elevation West Facing – High Elevation All sites got moisture from snowmelt Greenness Soil Moisture Soil Temperature Only lower sites got moisture from monsoon Precipitation East Facing – Low Elevation West Facing – Low Elevation Greenness appears to peak earlier at lower sites Day of Year Day of Year
Results East Facing – High West Facing – Low East Facing – Low West Facing – High 10-cm Soil Temp East Facing – High West Facing – Low East Facing – Low West Facing – High 10-cm Soil Moisture Normalized Greenness • West facing veg dynamics correlated with soil temperature • East facing high veg dynamics don’t appear to correlate with soil temperature or moisture
Results Difference between two Scans: 9/25/11 and 9/25/12 • Vegetation dynamics appear different when considered on a larger scale. • Vegetation appears to be more successful at the point of convergence, especially lower in the watershed. • West-facing aspect appears to be more successful than east-facing.
Take Home Points • Vegetation recovery was not uniform across the watersheds • Future forest structure may ultimately be triggered by differences in soil moisture and temperature • Slower post burn recovery of vegetation near the top of the watersheds will have consequences for ecosystem services, such as erosion and downstream deposition control • LiDAR and phenocams are valuable watershed management tools allowing analysis across very fine spatial and temporal scales
Thank You! Questions?