Download
1 / 27
270 likes | 404 Views
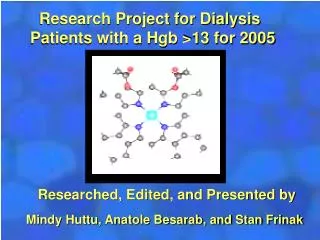
Research Project for Dialysis Patients with a Hgb >13 for 2005. Researched, Edited, and Presented by. Mindy Huttu, Anatole Besarab, and Stan Frinak. Introduction. Why are dialysis patients anemic?

E N D
Research Project for Dialysis Patients with a Hgb >13 for 2005 Researched, Edited, and Presented by Mindy Huttu, Anatole Besarab, and Stan Frinak
Introduction Why are dialysis patients anemic? • Anemia is measured as a reduction in hemoglobin (Hgb), the substance in red blood cells that carries oxygen. • Chronic Kidney Disease (CKD) patients become anemic as they loose kidney function. • This results from the loss of the Kidneys’ ability to produce the red blood cell stimulating hormone Erythropoietin (EPO). • To prevent Anemia, replace EPO produced in the kidney with “artificial” (genetically engineered) EPO. • Maintaining a near constant Hgb is not easy for doctors and patients to do.
What is Dialysis? • Type of therapyused to provide an artificial replacement for lost kidney function due to kidney failure. • It is a life maintaining treatment.Dialysis may be used for very sick patients who have suddenly lost their kidney function or for quite stable patients who, over time, have permanently lost their kidney function.
What is Hemoglobin, (Hgb)? • Hemoglobinis the oxygen-carrying protein in the red blood cells. In vertebrates, it transports oxygen from the lungs to the rest of the body. It also transports carbon dioxide to the lungs for removal.
What is EPO? Erythropoietin(EPO) is a glycoprotein hormone that is a growth factor for red blood cell precursors in the bone marrow. It is produced by the kidney, and is the hormone regulating red blood cell production. It is used in treating anemia resulting from chronic kidney disease or from cancer chemotherapy. EPO is generally injected under the skin of the patient. Several injections weekly are required for the original forms, but newer long-acting forms (Darbepoetin) may require injections only once every two to four weeks. EPO can also be injected into the blood stream directly. This route of administration is the preferred mode in dialysis patients.
When and how was EPO developed? • First postulated in 1906 based on transfusion experiments in rabbits. In 1950, the still unidentified erythropoietic factor was found to be stimulated in rats breathing a low-oxygen atmosphere. • In the 1960s its source was identified as the kidneys. • Human EPO was first purified from human urine by T. Miyake, C. K. Kung and E. Goldwasser at the University of Chicago in 1977. • EPO has now been identified with a molecular mass of about 30,000 Daltons. It has a 165 amino acid chain with four oligosaccharide side chains and circulates in the blood plasma at about 5 pmol/L.
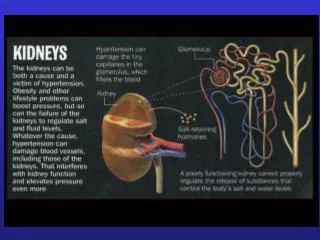
What is Chronic Kidney Disease? • Chronic kidney disease (CKD) is a slowly progressive loss of kidney function over a period of months or years and quantitated as low glomerular filtration rate. • CKD that leads to severe illness and requires some form of renal replacement therapy (such as dialysis) is called end-stage renal (kidney) disease (ESRD).
What is Anemia? • Anemia is the diminution of red blood cells that contain hemoglobin. This reduces the ability of blood to carry oxygen to the tissues. • Severity of anemia is measured as a decreased Hgb level below the normal range Male: 13 - 18 gm/dL Female: 12 - 16 gm/dL
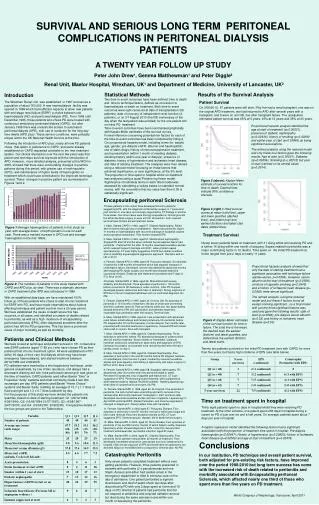
Aims of Study • Question: How well do doctors regulate the Hgb of dialysis patient’s? • Method: Examine the trends between EPO dose and Hgb in dialysis patients. • Goal: Can the data teach us how to do a better job of managing anemia?
Reducing EPO reduces Hgb three months later Hgb and EPO vs Time A good correlation between EPO and HGB level
Hgb and EPO vs Time Reducing EPO reduces Hgb three months later
Problems of using EPO • The effect of a given EPO dose can persist for up to 3 months. • Therefore, a change in EPO dosage may not alter the Hgb level to the desired level for up to several months.
Defining the Project • Physicians respond to Hgb levels only when limits are exceeded. • Low Hgb occur for many reasons, most of which are not under the control of the physician. • High Hgb, however, result from dosing by doctors and medical staff and are potentially modifiable.
Methods • Extract Data from data base • Sort with Access • Calculate in Excel • Analyze in StatView and develop graphs and study trends • Suggest Improvements in dosing strategies
Data 2005 Mean SD N Min Max Rolling Average(Hgb)12.1 1.43 1805 6.47 17.7 EPO Increase2223 2684 610 50 22000 EPO decrease- 1815 2502 810 - 22000 - 50 Hgb increase0.9 0.77 2263 0.1 11 Hgb decrease- 0.95 0.87 2145 - 12 - 0.1 Hgb Slope Inc mo2.95 7.24 2262 0.05 168 Hgb Slope Dec mo- 2.95 4.75 2145 - 78 - 0.07 Average number of times a patient Hgb exceeded 13 = 1.8 times per year
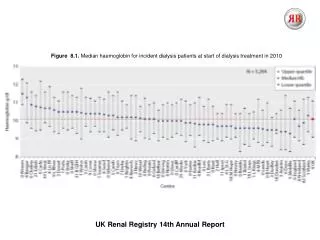
14 Hgb <11 (23%) 11≤ Hgb <13 (50%) 12 Percent 13≤ Hgb <15 (24%) 10 Hgb ≥15 (3%) 8 6 4 2 0 4 5 6 7 8 9 10 11 12 13 14 15 16 17 18 19 20 Hgb (g/dL) Hgb Distribution for 2005 207 Patients with a Hgb Value >13 (g/dL) N = 4862
16 15 14 13 Mean Hgb 12 11 (355) (279) (336) (541) (442) (684) (445) (492) 10 (313) (467) (222) (291) 9 N=(4878) 8 7 6 0 1 2 3 4 5 6 7 8 9 10 11 12 Time (mo) Mean Hgb measurements for all dialysis patients with a Hgb >13 for 2005 (time in months)
25 Mean = 0.0 ±1.1 N = 4644 20 Std. Deviation (±1.12) Percent 15 10 5 0 - 6 - 4 - 2 0 2 4 Change Hgb (g/dL) Change in Hgb Between Measurements 2005 Data
EPO Dose Hgb P <.0003 P <.0001 14000 16.0 Mean Diff: 621 12000 14.0 12.0 10000 14.0 10.0 8000 11.3 8.0 6000 6.0 4000 4.0 2000 2.0 5824 6445 0 0.0 Hgb ≤ 13 Hgb > 13 Hgb > 13 Hgb ≤ 13 Patient Data for Hgb ≤ 13 vs. Hgb > 13
FESAT CHR FERR P <.0065 P <.0001 P <.0154 40.0 45.0 900 40.0 800 35.0 35.0 700 30.0 30.0 600 31.5 25.0 31.9 25.0 500 20.0 20.0 400 15.0 15.0 300 10.0 28.3 25.9 10.0 200 5.0 100 5.0 412 448 0.0 0 0.0 Hgb ≤13 Hgb > 13 Hgb ≤ 13 Hgb > 13 Hgb ≤ 13 Hgb > 13 Patient Data for Hgb ≤ 13 vs. Hgb > 13
Hgb Values for an Individual Dialysis Patient 18 12000 42 days above Hgb 13 77 days above Hgb 13 17 11000 16 10000 Hgb (g/dL) 15 EPO units 9000 14 8000 13 7000 12 6000 11 5000 10 4000 9 150 days to increase above Hgb 13 3000 8 2000 7 1000 6 5 0 0 30 60 90 120 150 180 210 240 270 300 330 Time (in Days)
Reducing EPO reduces Hgb three months later Suggest Improvements in dosing strategies • A patients EPO dose should not be changed every month, because EPO effects can last up to 3 months or more. • A trend analysis (graph) of the patient’s data may be very useful in making dosing decisions. • A computerized anemia management system that recommends dosing change according to a set protocol could improve results.
24 Dialysis Patients on EPO Mean mo Hgb 2005 N = 2165 20 54% 16 Percent 12 8 8.2% 4 0 5 7 9 11 13 15 17 19 Mean Monthly Hgb g/dL Pre Dialysis Patients on Darbepoetin Last Monthly HGB N = 265 24 63% 20 16 Percent 12 8 4 0 5 7 9 11 13 15 17 19 Hgb (g/dL) Hemoglobin Distribution EPO vs. Darbepoetin UsingComputerized Anemia Management Program
Conclusions • The study showed that an individual patients Hgb can change over a wide range and the Hgb level did not always correspond to the patients EPO dose. • There are many things other than just the Hgb in which the doctors must look at to decide the amount of EPO which might be right for the patient. The current Hgb level, the current EPO dose and the patients iron status measure by FERR, TSAT, and CHR levels. • A trend analysis (graph) of the patient’s data may be very useful in making decisions. • A computerized anemia management program that uses a database to track changes in Hgb and EPO dose may help regulate Hgb levels in dialysis patients.
References • http://en.wikipedia.org • www.facstaff.bucknell.edu/.../Introduction.htm • http://images.search.yahoo.com/search/images/view?back=http%3A%2F%2Fimages.search.yahoo.com%2Fsearch%2Fimages%3Fp%3Dkidney%2Bdialysis%26rs%3D0%26ei%3DUTF-8%26fr%3DFP-tab-img-t-t400%26vf%3D&w=427&h=331&imgurl=www.ahealthyme.com%2FImagebank%2FMedEco%2F00042705.jpg&rurl=http%3A%2F%2Fwww.ahealthyme.com%2Ftopic%2Fdialysis&size=24.3kB&name=00042705.jpg&p=kidney+dialysis&type=jpeg&no=5&tt=12,773&ei=UTF-8 • ase.tufts.edu/biology/.../index.asp?PP=kidneys • www.sportujeme.sk • www.asnanaka.com/m/.../MedicalGlossary/images?D=D • www.komsta.net/chemwalls/hemoglobin-1280.jpg • http://en.wikipedia.org/wiki/Hemoglobin • www.pacifichealth.com/shop/media?M=D • http://www.henryfordhealth.org/
Data 2005 Mean SD N Min Max Rolling Average(Hgb)12.1 1.43 1805 6.47 17.7 EPO Increase2223 2684 610 50 22000 EPO decrease- 1815 2502 810 - 22000 - 50 Hgb increase0.9 0.77 2263 0.1 11 Hgb decrease- 0.95 0.87 2145 - 12 - 0.1 Hgb Slope Inc mo2.95 7.24 2262 0.05 168 Hgb Slope Dec mo- 2.95 4.75 2145 - 78 - 0.07 Average number of times a patient Hgb exceeded 13 = 1.8 times per year