Download
1 / 17
200 likes | 380 Views
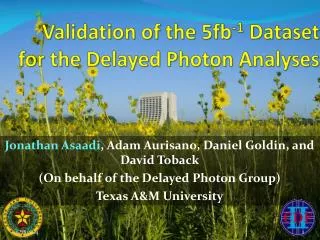
Reproducing E T Promotion and Demotion Study in Data for the Delayed Photon Analyses. Jonathan Asaadi, Adam Aurisano, Dave Toback. Outline. Introduction to Gauge Mediated Symmetry Breaking Physics Observation of excess and The Promotion Effect Looking for Promotion Effect in data

E N D
Reproducing ET Promotion and Demotion Study in Data for the Delayed Photon Analyses Jonathan Asaadi, Adam Aurisano, Dave Toback J Asaadi Texas A&M
Outline • Introduction to Gauge Mediated Symmetry Breaking Physics • Observation of excess and • The Promotion Effect • Looking for Promotion Effect in data • Event Selection • Comparing with Monte Carlo / Validating Event Selection • Promotion Effect in Data • Conclusions / Next Steps J Asaadi Texas A&M
Introduction to GMSB Insert Text J Asaadi Texas A&M
Introduction to GMSB(Accounting for all possible sources) Insert Text
Promotion Effect Study Explanation about Promotion Effect CES Energy Read Out = E Radius CES = RCES = 181.15 cm DistanceCES-Vertex z = 0 z = Vertex 11/13/2014 Jonathan Asaadi Texas A&M J Asaadi Texas A&M 5
CES Energy Read Out By The CEM RCES = 181.15 cm Explanation about Promotion Effect DistanceCES-Vertex DistanceCES-Vertex MC ETmeas > 45 GeV Mean: 0.417 RMS: ? ETmeas > 45 GeV && ETtrue < 45 GeV Mean: 0.86 RMS: ? ETmeas > 45 GeV && ETtrue > 45 GeV Mean: 0.12 RMS: ? ETmeas < 45 GeV && ETtrue > 45 GeV Mean: -0.69 RMS: ?
Event Selection Flow Diagram Selected on WNOTRACK Trigger # of Events = 291,518 L = 570 pb-1 Pre-Selection Cuts Pre-Sample # of Events = 208,644 Highest SPt Vertex is Wrong Vertex - Electrons are required to be Central Electrons and must pass standard Identification cuts Wrong Vertex Pre-Sample # of Events = 56,891 - Electron Track is removed from Vertexing
(Wrong) Vertex Information Data Mean: 0.004 RMS: 1.282 Mean: 0.072 RMS: 1.273 MC Good Agreement between MC and Data Mean: 1.024 RMS: 25.46 Data Mean: 0.231 RMS: 26.19 MC
(Wrong) Vertex Information Data Vertex SPt SPt Distribution flat in Z Data J Asaadi Texas A&M
Electron Track Information Mean: 0.75 RMS: 25.88 Mean: 1.085 RMS: 24.04 Data MC Mean: 0.004 RMS: 1.282 Mean: -0.009 RMS: 1.407 MC Data
Delta Z and Delta t for Wrong Vertex DZ Wrong Vertex, Electron Z Dt Wrong Vertex, Electron Z Data Data Dt vs.DZ Data
Looking for Promotion Effect Calculating the corrected time for Wrong Vertex… Data Signal Region = 2381 Number of Events w/ 2 ns < tcorr < 7 ns Control Region = 2088 Number of Events w/ -7 ns < tcorr < -2 ns
Looking for Promotion Effect in Data Wrong Vertex Pre-Sample # of Events = 56,891 Data Calculating using Wrong Vertex Signal Region = 2381 Number of Events w/ 2 ns < tcorr < 7 ns Control Region = 2088 Number of Events w/ -7 ns < tcorr < -2 ns Data Data
Comparing Data and Monte Carlo Data MC Events above the cut are promoted in the signal region Data MC Events are both promoted and demoted
Looking for Promotion Effect MC ETmeas > 45 GeV Mean: 0.417 RMS: ? ETmeas > 45 GeV && ETtrue < 45 GeV Mean: 0.86 RMS: ? ETmeas > 45 GeV && ETtrue > 45 GeV Mean: 0.12 RMS: ? ETmeas < 45 GeV && ETtrue > 45 GeV Mean: -0.69 RMS: ? Data ETmeas > 45 GeV Mean: 0.417 RMS: 2.11 ETmeas > 45 GeV && ETtrue < 45 GeV Mean: 0.812 RMS: 2.13 ETmeas > 45 GeV && ETtrue > 45 GeV Mean: 0.111 RMS: 2.05 ETmeas < 45 GeV && ETtrue > 45 GeV Mean: -0.610 RMS: 2.02
Looking for Promotion Effect Data ETmeas > 45 GeV Mean: 0.417 RMS: 2.11 Signal Events = 1,237 Control Events 674 ETmeas > 45 GeV && ETtrue < 45 GeV Mean: 0.812 RMS: 2.13 Signal Events = 684 Control Events 233 ETmeas > 45 GeV && ETtrue > 45 GeV Mean: 0.111 RMS: 2.05 Signal Events = 553 Control Events 441 ETmeas < 45 GeV && ETtrue > 45 GeV Mean: -0.610 RMS: 2.02 Signal Events = 82 Control Events 199 Excellent agreement between the Monte Carlo observation of the promotion effect and observation of this effect in data