Download
1 / 31
310 likes | 414 Views
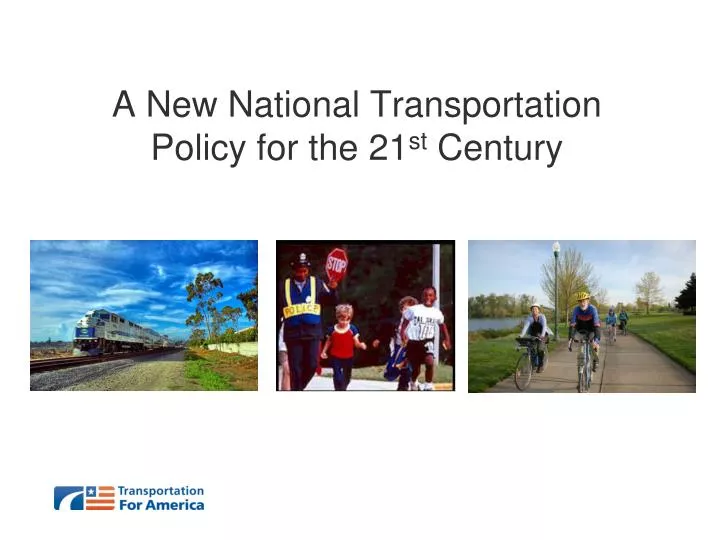
A New National Transportation Policy for the 21 st Century. T4America Executive Committee. 20-year Performance Targets. Triple walking, biking, and public transportation usage Increase access to essential destinations by 30 minute transit ride or 15 min walk

E N D
20-year Performance Targets • Triple walking, biking, and public transportation usage • Increase access to essential destinations by 30 minute transit ride or 15 min walk • Reduce household transportation + housing expenditures • Increase proportion of freight transportation provided by railroad and intermodal service by 20% • Achieve zero percent population exposure to at-risk levels of air pollution Flickr user: karolik Flickr user: portlandbike.org Introduced as HR2724 (Carnahan, Holt, Inslee)
Transportation and a 21st century economy Location, Location, Location
Improving the country's economic and job situation 94% % Top Priority 75% Reducing federal spending 69% Ending our dependency on foreign oil 68% Reforming health care Improving public schools 67% Repairing the country's roads, bridges, railroads, airports, mass transit and other transportation infrastructure needs 44% Increasing spending on transportation infrastructure projects such as roads, bridges, railroads, airports, and mass transit 40% 30% Addressing climate change Economic growth remains job number one for Washington, though there is growing concern about federal spending.
By a significant margin, Americans say safer streets should be the primary objective of increased infrastructure investment. Safer streets for our communities and children 56% First Choice – 42% More transportation options 31% 16% Less money spent out-of-pocket on transportation 27% 8% 22% A faster commute to/from work 10% 20% Less time spent in the car 7% 19% 9% High speed inter-city travel Ranked by % Combined Choice 9% 4% More predictable travel times
The vehicle mile traveled charge and increases in fees and gas taxes are met with resistance.
The Future of Transportation • Metropolitan Regions • that link to one another with roads, air, bus and high speed rail • but also compete with one another for funding, business, people • Goodbye gasoline tax, hello distance & congestion pricing • Competitive grants from federal and state levels • Smarter, more coordinated public transportation • Focus on the big and the small – walkable communities
Work with Us! Join us at t4america.org Contact Ilana Preuss at ilana.preuss@t4america.org Flickr user: tallkev
On behalf of Building America’s Future (BAF), Public Opinion Strategies and Greenberg Quinlan Rosner Research are pleased to present the key findings of a nationwide telephone survey. The survey was completed June 30 – July 2, 2009 among 800 adults. This study has a margin of error of +3.46%. Slide 13
There are clear trends on which demographic groups believe infrastructure needs to be a top priority. Repairing Transportation Infrastructure Increasing Spending On Infrastructure
While a majority of Americans say the most-used infrastructure items are in good condition, there is little intensity driving this sentiment. Condition of Transportation Infrastructure Systems 51% 51% 49% 33% 31% 25% 17% 17% 13% 10% 7% 7% Bridges Sidewalks and Roads and Bike Paths Highways Excellent Excellent/Very Good Fair Poor/Very Poor
Traffic congestion receives the most negative ratings, while Americans are clearly less confident in their ratings of mass transit. Condition of Transportation Infrastructure Systems 34% 31% 31% 30% 23% 23% 21% 15% 12% 7% 4% 3% Traffic congestion Mass transportation systems (subway, light rail, busses) Intercity passenger rail, like Amtrak Excellent Excellent/Very Good Fair Poor/Very Poor
Excellent/Very Good Poor/Very Poor Those with longer commutes give the condition of traffic congestion lower marks. Condition Of Traffic Congestion By Workers Who Drive +17%-6%-18%+3%-1% 41% 39% 34% 33% 31% 31% 32% 31% 30% 28% 24% 21% Overall Drive 0-29 Drive 30+ Drive 60+ Drive 0-31 Drive 32+ Minutes Minutes Minutes Miles Miles (19%) (38%) (19%) (38%) (18%)
69% 61% 59% 54% 43% 40% 38% 31% Total Agree Total Disagree Commuters, especially non-car commuters, are unwilling to believe the government can’t fix the problem. “As I read each one, please tell me whether you agree or disagree with that particular statement: Traffic congestion is a fact of life and there is nothing the government can do to really fix it.” -19% -23% -38% -11% Overall Car Commuters Non-Car Commuters Do Not Commute (50%) (6%) (44%)
Total Agree Total Disagree A Majority of Americans believe our transportation system is outdated and behind those in other parts of the world. “Our nation's transportation infrastructure is outdated, unreliable and inefficient.” “Some of the world's best transportation systems are in Europe and Asia, and not the United States.” 62% 55% 42% 41% Strongly Agree 27% Strongly Agree 20%
+8% +34% +16% 67% 56% 53% 45% 40% 33% Total Agree Total Disagree The “outdated, unreliable, and inefficient” sense is strongest among non-car commuters. Transportation System Is Outdated By Commuters Car Commuters Non-Car Commuters Do Not Commute (50%) (6%) (44%)
Nearly everyone agrees that transportation funding decisions are politically driven. “As I read each one, please tell me whether you agree or disagree with that particular statement. Transportation infrastructure funding decisions are based more on politics than on need.” Total Agree 85% 62% Strongly Agree Total Disagree 13% Don't Know 2%
64% 60% 59% 48% 33% 24% 23% 20% Total Agree Total Disagree Six out of ten – Republicans and Democrats, alike –believe the gas tax goes up every year. “As I read each one, please tell me whether you agree or disagree with that particular statement. The federal gas tax, which pays for roads, transit and transportation infrastructure, increases every year.” +37% +35% +15% +44% Overall Republican Independent Democrat (37%) (15%) (46%)
The Bottom Line Finally, it is also important to remember who you’re talking to. Those who are more concerned about the condition of the nation’s transportation infrastructure and more supportive of making it a top legislative priority are: - 23 -
These are the groups that are with us: Middle-aged men, men with incomes over $80,000, men with a college education or more Dads who commute Men ages 55 years or older
That’s because they are more attuned to the nation’s infrastructure needs. • High issue recall across the board • 58% of middle-aged men say it’s getting worse • 50% of high income men say we should spend more money • 55% say infrastructure is getting worse • 53% say increasing spending on infrastructure is a top priority • 55% issue recall • By a 23-point margin, say we need to spend more money • 58% say repairing our infrastructure is a top priority
The Bottom Line The groups we need to do a better job talking to about transportation infrastructure investment are (our target groups): - 26 -
This is who we should be targeting: + Homemakers, Stay-At-Home Moms, and Women Under the Age of 35 Women Without a College Degree and Women Making Under $40,000 a Year
They’re target groups because they are… + • More likely to believe transportation infrastructure is getting better (not worse) • Don’t see a need to boost spending • Don’t see this as a top legislative priority • Divided on whether transportation infrastructure is getting better or worse • Not sure if we should spend more or less money • More inclined to see “repairing infrastructure” as a top priority than “increasing spending”
And, here’s something interesting: + • Stay-at-home moms spend an average of 50 minutes a day on the road and 33% say their kids get to school by walking. • Less educated women say they drive an average of 70 minutes a day for non-work related reasons (errands, taking kids to school); the average among lower income women is even higher – 93 minutes a day.
And, among these target groups, the “safety” message is supremely important.
The Bottom Line And, that leads up to our final take-away point:investing in transportation infrastructure is about people, not concrete.It’s about keeping roads, bridges, tunnels, etc. safe for us to use and for our kids to play on and travel on. Rather than talk about the need to build “things,” we should be talking about the importance of building safer communities. - 31 -