Download

1 / 24
270 likes | 457 Views
Quantitative techniques. Peter Shaw. What are you doing here?. Timewise:. Write thesis. Viva. Read a lot. Register. academically. Establish a link between this body of theory and the real world. Show your mastery of these by re-writing these in creative new ways or finding new links.

E N D
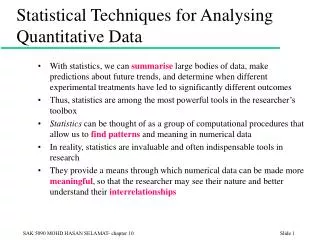
Quantitative techniques Peter Shaw
What are you doing here? Timewise: Write thesis Viva Read a lot Register academically Establish a link between this body of theory and the real world. Show your mastery of these by re-writing these in creative new ways or finding new links. Assimilate existing body of memes (in this case theories + facts)
Academics have created many interconnected (or not!) bodies of theory, and I would not dream of telling you how these should be constructed or understood. You will have an extensive body of theories from standard texts and papers in your head. Call them up. Stop, step back, and ask yourself WHY you have ended up learning this particular set of ideas, as opposed to the ideas held in the myriad of other papers in your subject’s history. I cannot tell you, at least not for the arts subjects, and my suggestion would be ‘random drift’ – the vagaries of fashion, just as ecologists find that the best model for explaining species distributions is a totally random directionless turnover of species – the Null model..
Some bodies of theory link to the outside world – predictions of outcomes, or (for historians) estimates of how likely certain events may have been. Without this linkage, entire bodies of internally consistent theory can spiral off for ever, advancing nowhere and quite possibly coming up ideas that collapse into dust if checked against reality. Does this matter? A lot of mathematical theory started out as academic musings, only to become important many years later. (The Greeks studied conic sections: these actually became useful in the 17th century. Number theory derived in the 1930s and 1940s turned out to underpin advances in encryption that allow us to communicate securely with our online banks.) Being disconnected is fine, IF the body of theory is internally consistent and verifiable by any independent analyst. It is NOT fine if it degenerates into formless and inconsequential woffle.
Alan Sokal and the Social Text affair Transgressing the Boundaries: Towards a Transformative Hermeneutics of Quantum Gravity. Alan D. Sokal, Department of Physics, New York University4 Washington Place, New York, NY 10003 USANote: This article was published in Social Text#46/47, pp. 217-252 (spring/summer 1996). “For some years I've been troubled by an apparent decline in the standards of intellectual rigor in certain precincts of the American academic humanities. But I'm a mere physicist: if I find myself unable to make head or tail of jouissance and diff'erance, perhaps that just reflects my own inadequacy. So, to test the prevailing intellectual standards, I decided to try a modest : Would a leading North American journal of cultural studies publish an article liberally salted with nonsense if (a) it sounded good and (b) it flattered the editors' ideological preconceptions? The answer, unfortunately, is yes. “
There are two ways to stop this kind of junk infecting a body of memes. 1: The theory must be cast-iron and internally consistent, so that an external analyst can validate results. 2: The theory must be tested against the outside world n some way to see whether it actually works. Here, in the links to the outside world, is where we start dealing with quantifiable data, and where numerical analyses have to be considered. The advantage of numerical analyses is their power to summarise succinctly and objectively : they allow one to convert verbal information into pictures (very helpful for explaining), and allow one to generate estimates of how likely a pattern is to have occurred by chance. Annual S. bovinus sum 1997-2001 P<0.05 0 100 200 300 400 0 thinned
People are well designed for stone-age survival; good visual maps, plenty of paranoia to make insure against a bad future etc, but there is one area where we are REALLY poorly designed, which is in our understanding of randomness. Humans see patterns where no patterns exist. If you make a statement anywhere in your research about a pattern in the outside world – especially one which fits your preconceptions – someone should challenge you that it is merely random noise. There is a constant danger of academic texts being infected by “results” that are nice ideas but are really based on random, patternless observations. ANYONE who avoids quantitative analysis lays themselves open to this.
Graphs showing two patterns that might be found, say in spatial data (location of houses) or abstract data (questionnaire scores). What patterns are there here that you would want to explain to prove your academic skill and insight?
The top pattern is random! Despite what you may think, the top pattern has no story to tell – it is a genuinely random pattern. The bottom one needs explaining – I had to work hard to smooth the dots out to a near-even spacing. The null hypothesis of random distribution stands for the top, clustered pattern but not the bottom, unclustered one. This is exactly the opposite of what our intuitions tells us. We are poor at predicting the behaviour of randomness.
Without a good design, a project is worthless • Rothamsted had to throw away 50 years worth of meticulously collected data from an experiment because the design was faulty • No amount of analysis or literature review can save a bad design - this is utterly crucial
The plan for today: 2 crucial ideas to introduce: The Null hypothesis The Control group One exercise we all do (should improve your origami if nothing else!) I then stop talking to you as a group and offer my services to anyone needing a consultation about design/analysis/presentation.
The Null Hypothesis, H0 This is the most important intellectual tool yet discovered for linking theory to observations. Often the most probing question I can ask a PhD student about their experiment is “What is your Null Hypothesis?” The null hypothesis is one of 2 competing models which you apply in linking your findings to reality. It basically states: “There is nothing to explain here, these data are patternless random noise and the fact that I can perceive a pattern is due to chance alone”. It stands in competition with the Alternative Hypothesis, H1, which is the model you are interested in fitting. Think of a courtroom putting your data on trial- 2 verdicts are allowed: Guilty (the data and the model are linked – H1), or not Guilty (H0: there is no connection). Just as in court: innocent until proven guilty. H0 is believed until you acquire compelling evidence against it.
Examples: You add fertiliser to plants. H0: there is no effect H1: there is a growth response. You hypnotise athletes prior to their performance H0: There is no effect of hypnosis H1: The hypnotism affects their performance You study the distribution of incomes in 19th century London and notice that the rich lived upwind of industrial areas. H0: areas chosen by high income families were unrelated to air quality H1: High income families avoided poor air quality.
The value and power of the null hypothesis is this: It provides the only intellectual defence against a particular, insidious and dangerous line of attack against any experimental finding. The line of attack goes as follows: It starts off with the scenario that you have collected some data. I don’t really care what sort of data, what type of information, what your aims were. You examine these data and you see a pattern. Perhaps the males have different responses to the females, the urban site gives different values to a woodland one. So your face lights up with a beam of triumph – you have made a research discovery!! Then imagine a face looking over your shoulder (mine even!), making two observations. 1: There is unexplained variation in your data. (Always true). 2: The pattern you allege may simply be random variation, arising by chance and needing no explanation.
How do you respond to this killjoy? The usual first reaction is to get cross! (And a few self-styled researchers don’t get beyond this stage). But if you stop here you have lost, and the ‘demon of the null hypothesis’ has won. Your pattern COULD have arisen by chance; to deny that is to delude yourself. There is only one defence. You say something along the lines of “Yes, of course, you may be right, this pattern could have occurred by chance. BUT I have considered this possibility and estimated how likely it is that such a pattern would occur in my data by chance. The likelihood of this pattern occurring is so low that I have decided to reject the null hypothesis, and instead believe that my pattern is real”.
Control • This requires you to have a group of samples / subjects which are not subjected to the treatment of interest, to offer a comparison. • Often in experiments this is easy: Don’t add fertiliser, don’t add lead etc • (Is actually linked at a deep level with your H0 and can conceal serious pitfalls – get your designs checked by an external expert)
Control • Needs thought with some factors: temperature, pH • The concept needs modification for surveys, esp. sociological ones • use a contrast (M/F, age ranges, etc) • find a steady gradient and follow it
Replication • Never just sample anything once! • A minimum # reps is 3 • The more replicates the better, but check your time/equipment budgets.
Examples of fatally-flawed designs Actually it is surprisingly easy to get a design wrong. (I should know…) Here are a couple of examples where weak designs have had an impact on public policy. Speed cameras at accident black spots: There have been government-sponsored schemes to explore whether putting speed cameras at accident blackspots reduces accidents. In a trial around 2000 cameras were introduced at some of the worst, most dangerous accident blackspots. After 18 months death rates had fallen by 60%. The problem? That the cameras were not introduced randomly, but only at the worst spots. Consider H0: there was no camera effect or difference between accident spots since variations were due to random noise. Under H0 YOU EXPECT THE WORST SPOTS TO GET BETTER next year!! The cameras should have been placed in a random subset.
Why schools start kids so early over here This one is bar-room gossip with a NERC statistician, but I give it you as a thought experiment that just might be true. The UK starts its kids on alphabet, reading etc several years before our continental cousins – this is often very hard for small boys. Why? Because of research showing that kids who started learning earlier did better in later academic achievements than a control group. So far so good. The point I picked up about this was that the initial allocation of kids to treatments was not random but under parental control. “Do you want your child to have their education pushed earlier?” The parents who said yes to this were simply not a random subset – they pushed their kids. NOTHING AT ALL could save this design once created and no useful conclusions can be drawn from it. The allocation of children should have been randomised.
What we are going to do today: Is to explore something creative, fun, silly, utterly unconnected to anyone’s research here, and tests a belief which has been an article of faith for me since about the age of 10. Should one tear out a tail when making a paper dart? (I always have done – maybe I have been wasting my time?) Tear here H0: The presence of a tail has no effect on flight performance H1: The presence of a tail affects performance.
So – I make a plane with a tail and throw it. It flies well, better than I remember. Does that prove a tail helps? I throw 4 planes with tails and they all fly well. Any better? No – H0 stands because you have not amassed enough evidence to reject the possibility that the tail makes no difference. Control: You MUST have a control group of tail-less planes, in order to have a chance of rejecting H0. How about other confounding factors? If a 2m bloke throws the tailed plane and a 1.4m girl takes the tail-less one, how valid are your results?
Your turn! I will give you a quick tutorial in plane folding (so we have a common model), then you divide into groups and design a simple experiment exploring how far different members of your team can get different models of plane. Record your distances, and as these come in I will show you how to convert these data into simple user-friendly graphs. One tip –please put your name + a code on each plane, in case of confusion! I will also do for you the analyses needed to test H0 by assessing how likely the pattern is to be be random (we use a wonderful powerful technique called Analysis of Variance, ANOVA to its friends, invents by RA Fisher in the 1930s. Almost any experiment or survey design can be expressed as an anova model, and I have rejected PhD proposals at RDC because the design had an invalid model).
Factorial designs: • These are the most powerful design available, and allow one to probe the effects of multiple treatments and their interactions. • The essence of these is that whatever treatments are imposed, all combinations of treatments are imposed with the same level of replication. • You want to study fertiliser and pesticide on plant yield. The basic design is +/- fertiliser and +/- pesticide, each replicated (say) 4 times. This design is 2*2*4 reps = 16 plots. How many plots needed for 3 *3 with 5 reps?