Download

1 / 26
260 likes | 403 Views
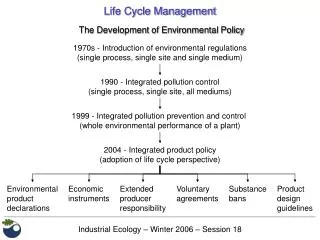
Application of the DOI for Policy Development. June. 2006. C. M. Cho cmcho@kado.or.kr. Contents. I. Benchmarking of Other Indices. II. Review of the DOI. III. Development of the Policy Tool. Benchmarking of Other Indices. Network Readiness Index.

E N D
Application of the DOI for Policy Development June. 2006 C. M. Cho cmcho@kado.or.kr
Contents I. Benchmarking of Other Indices II. Review of the DOI III. Development of the Policy Tool
Network Readiness Index Global Information Technology Report - WEF, INSEAD Network Readiness Index Readiness - individuals - business - government Usage - individuals - business - government Environment - market - policy & regulatory - infrastructure • 9 sub-indexes, based on 48 indicators (survey and public data), • produce rankings for 102 countries, 2002-3
Monitoring the digital divide Monitoring the Digital Divide - ORBICOM INFOSTATE • Infodensity (ICT stocks) • - Network • Main telephone lines per 1,000 persons • Cellular subscribers per 1,000 persons • - Skill • Adult literacy rates • Gross enrollment ratios • Info-use (flows of ICTs) • - ICT uptake • Radio per 1,000 persons • Proportion of households with TV • Proportion of households with cable or satellite connections • Computer per 1,000 persons • Internet users per 1,000 persons • - ICT intensity of use • International outgoing telephone traffic per inhabitant • ICT spending as % of GDP • 4 components, based on 21 indicators (public data), • produce time-series for 139-192 countries, 1996-2001
Digital Access Index The Digital Access Index - ITU DAI Infrastructure Knowledge Affordability Quality Usage Infrastructure : Fixed telephone and mobile cellular subscribers Affordability : Internet access price Usage : Internet users Quality : Broadband subscribers, international internet bandwidth Knowledge : Literacy, school enrollment • 4 components, based on 8 indicators (public data), • produce rankings for 178 countries, 2002
ICT Development Indices ICT Development Indices - UNCTAD ICT DIFFUSION Connectivity Policy Access Connectivity : Internet hosts per capita, number of PCs per capita, telephone mainlines per capita, cellular subscribers per capita Access : Internet users per capita, Literacy, GDP per capita, Cost of a local call Policy : Presence of internet exchange, competition in local loop telecoms, competition in domestic long distance, competition in ISP market • 3 components, based on 22 indicators (public data), produce rankings for 166-200 countries, 1999-2001
Information Society Index Information Society Index - IDC Information Society Index Computer Social Telecom Internet Computer : PCs per household, IT spending/GDP, IT service/GDP, Packaged software/Total IT Telecom : Broadband Households, Wireless subscribers, Handset Spending /GDP Internet : Internet users, Mobile internet users, home internet users, e-commerce spending Social : Secondary Education Enrollment, Tertiary education enrollment, Civil liberties, Corruption index • 4 components, 15 indicators (survey, unpublished data), produce rankings for 52countries, 2000 to 2008
Summary of Existing Indices Summary of Indices
Evaluation of existing Indices Two many indicators - 48 indicators ine-readiness index Outdated indicators - Radio and TV in Infostate Subjective or Unpublished indicators • Using opinion survey date in e-readiness index - Using unpublished date in ISI Not relevant • GDP per Capita(ICT Development Indices) • Literacy, School enrollment (DAI, ICT Development Indices)
Idea Structure of the DOI Category Sub-Category Utilization Usage Level Internet usage Telephone usage Quality of usage Bandwidth Ability Digital literacy Opportunity Affordability Affordability of tel service Coverage Geographic coverage of tel service Accessibility Accessibility for the handicapped Infrastructure Network Tele-density Internet-density Device Computer Hand held device
Infrastructure Network • Proportion of households with a fixed lines telephone • Mobile cellular subscribers per 100 inhabitants • Proportion of households with Internet access at home • Mobile Internet subscribers per 100 inhabitants Device 수신 차단 방안 강구 • Proportion of households with a computer
Opportunity Affordability • Mobile cellular tariff as a % of per capita income • Fixed telephony tariff as a % of per capita income • Internet access tariff as a % of per capita income Coverage 수신 차단 방안 강구 • % of population covered by mobile cellular telephony • Number of telecenter per 1,000 persons • % of population covered by fixed telephony • % of population covered by internet service Accessibility 수신 차단 방안 강구 • Existence of guideline or regulation for the accessibility of the people with disabilities
Utilization Usage • FixedInternet users per 100 inhabitants • Mobile Internet users per 100 inhabitants • Fixed telephony users per 100 inhabitants • Mobile telephony users per 100 inhabitants Quality • Ratio of (fixed) broadband internet subscribers to total Internet subscribers • Ratio of (mobile) broadband internet subscribers to total mobile Internet subscribers Ability 수신 차단 방안 강구 • Rate of digital literate per 100 inhabitants
Special Features of the DOI Household focused - Internet and PC are shared by members of household Opportunity related Indicators - Coverage, Affordability, Accessibility Transparency - Only objective indicator Simple - Possible to include as many nations as possible New technology oriented - Delete radio and TV, while focusing Broadband -9-
Policy Tool based on single variable analysis First Stage : Grouping Countries into Certain Types • - Make distribution chart of all six indicators (network, device, affordability, coverage, usage, quality • Categorizing all countries into certain types (High, Middle, Low or High, Low) For instance, scoring .5 or above is high scoring .2 to .5 is middle scoring .2 or less is low • Method for categorizing .2 and .5 should not be decided not by allotting equal number of cases to the groups, rather .2 or .5 should have a real meaning
Policy Tool based on single variable analysis Hypothetical Distribution Chart of Network Number of Countries High Low Middle 0.2 0.5 Network
Policy Tool based on Single Variable Analysis Second Stage : Suggestion of Policy Tips • Identify policy issues for particular indicators (Network, Device, Affordability, Coverage, Usage, and Quality) • Sort policy issues and develop policy tips by certain types(Low, Middle, High) • Repeat this process for all 6 indicators • While considering common characteristics of each group(high, middle, low) Demographic factors : Size of Pop., Pop. density, Geographic factors : Size of Territory Economic factors : GDP, Economic growth rate Social factors : Literacy rate, rate of school enrollment
Summary Table of Policy Suggestion High Middle Low
Policy Tool based on Multivariate Analysis Why Multivariate Analysis - Possible to make more detail grouping by multi- dimension analysis e. g. good in network but poor in device, good affordability but poor coverage - More accurate and customized policy suggestion 1st Stage:Analysis of Relationship between Indicators • - Calculate the magnitude of relationships of all 15 possible pairs between six indicators (e.g. network – device, network – affordability Network – coverage, affordability – coverage) • Compare and analyze the relationships
Policy Tool based on Multivariate Analysis 2nd Stage - Identify meaningful combination between indicators after careful review of the relationships of indicators - Suggest customized policy tips for the countries of certain types by using method like Delphi Method
Policy Suggestion based on Multivariate Analysis High Affordability Low Low High Coverage
Refinement and Modification of Policy Guideline Follow up of Policy Tool • Conduct case study to apply suggested policy tools • Continuous modification and refinement of Guideline not only policy tips but also grouping of countries