Download

1 / 14
140 likes | 222 Views
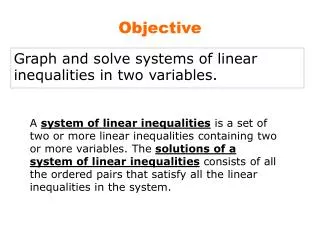
Learn how to represent solutions and constraints in linear inequalities by graphing multiple variable scenarios. Practice with stamp value and fruit buying examples.

E N D
How do you model a problem in which you have two or more variables that must total less than a specific amount? For example, how can you find how many of each type of stamp you need on a package that requires an exact amount of postage?
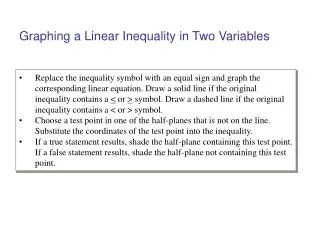
In this lesson you will learn how to represent solutions and constraints to linear inequalities by graphing.
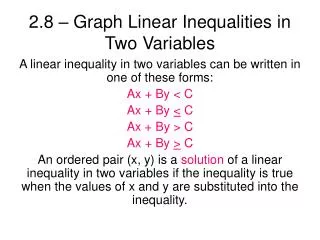
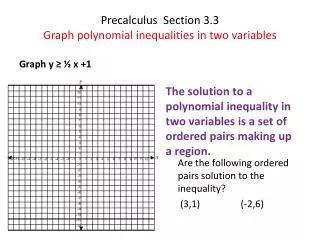
You can graph an inequality in two variables. 5x + 6y ≤ 30
Not accounting for a constraint Can’t I just keep adding stamps until I have enough money? If you only have certain kinds of stamps, you might pay too much!
You need $1.00 worth of postage to mail a package. Entire book of $0.03 stamps but only four $0.32 stamps How many of each type can you use?
(amount of money using $0.03 stamps) (amount of money using $0.32 stamps) + ≥ $1.00 $0.03(x) + $0.32(y) ≥ $1.00
$0.03(x) + $0.32(y) ≥ $1.00 Constraints: 1. Positive numbers only 2. Whole numbers You will need at least 12 $0.03 stamps and 2 $0.32 stamps.
In this lesson you have learned how to represent solutions and constraints to linear inequalities by graphing.
Your school needs at least 35 students to help volunteer at a shelter downtown. Seven students can ride to the shelter in each van, and five students can ride in each car. Draw a graph showing all of the combinations of vans and cars possible for the problem.
Choose two types of fruit, such as strawberries and watermelon. Write an equation for and graph a linear inequality to show how much of each fruit you could buy without spending more than $10 total.
Draw a polygon on a coordinate plane. Write a series of linear inequalities that, graphed and shaded correctly, would result in the given polygon.
An air cargo plane can transport as many as 15 regular shipping containers. One super-sized container takes up the space of 3 regular containers. Write and graph a linear inequality to show this situation, and find two solutions to this problem.
Your school needs at least 35 students to help volunteer at a shelter downtown. Seven students can ride to the shelter in each van, and five students can ride in each car. Find the minimum number of cars needed if three vans are available.