Download
1 / 28
280 likes | 389 Views
Air Pollution and Lung Cancer in Texas. Joseph Oppong and Sarah Whyman University of North Texas. Changing rates of cancer mortality at specific sites, age adjusted to the US population 2000. Source: American Cancer Society. 1999 population.

E N D
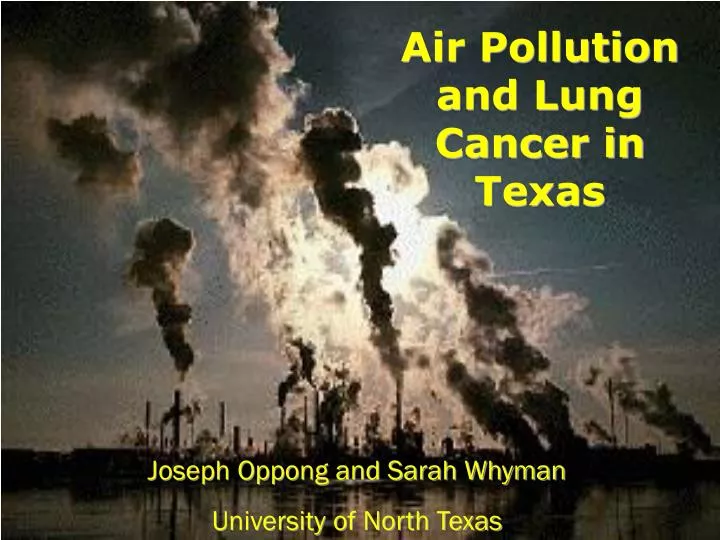
Air Pollution and Lung Cancer in Texas Joseph Oppong and Sarah Whyman University of North Texas
Changing rates of cancer mortality at specific sites, age adjusted to the US population 2000. Source: American Cancer Society
Population 1999 with overlay of deaths, from 1980 to 1998. Contrasting death and mortality rates Population 1999 with overlay of mortality rate from 1980 to 1998
Texas also has a very high allergy rate. Natural air pollution from pollens was not investigated and radon is at a moderate level in a few counties but low in most of Texas
Disproportionate NOx and PM emissions produced by diesel-powered vehicles compared to the percentage of diesel-powered vehicles on the road.
These maps show total deaths from lung cancer (left) and death rates (below) from 1980 to 1998 overlaying a map of diesel particulate matter. Total deaths 1980 to 1998 The deaths are again higher and the death rates lower in more populated counties, with higher diesel exhaust concentrations also occurring in these areas. Death rates 1980 to 1998
Total toxic pollutants with an overlay of mortality rates. In contrast to other maps the pollutants do not completely match the more populated counties. Pollutants in pounds
Counties with low populations and high deaths Rains - 240 Lampasas - 90 Sabine - 1600 Trinity - 0 Llano - 1700
The pollutants released by electricity production, with death rates overlaying. Death Rates Emissions, tons
The current situation. In the first map it can be seen that there are many counties where no specific cancer care is available. Population in 1999 is also shown.
Percentage of elderly people living below the poverty level, highlighting the inadequacy of the federal centers - map repeated below
This map offers the information on both federal centers and cancer care centers with red markers showing high mortality rates and blue markers showing lowest rates, in the counties without adequate health care.
Health data in the US is not as comprehensive as in many countries, due to aspects of private health care and privacy laws, therefore it is difficult to pinpoint specific cases. This study was carried out at the county level, retaining anonymity but losing accuracy. One of the main points that emerged from the study is of health care being an important factor, not only in treatment, but in timely diagnosis of cancer and in education outreach, as many forms of cancer are linked to lifestyle. The political aspects of the study are incriminating, in that industry has powerful friends and risk factors are looked at primarily from an economic perspective, rather than health.
I would not want this study to exonerate smoking as a causal agent in lung cancer, although the statistics show a negative correlation. Other more powerful studies have identified tobacco smoke as a powerful carcinogen.
Health Data for this research came from: Texas Department of Health, http://www.tdh.state.tx.us Texas Cancer Data Center, http://www.texascancercouncil.org Business and Industry Data Center,http://www.bidc.state.tx.us Centers for Disease Control, http://www.cdc.gov. Pollution Data from: Environmental Protection Agency Toxic Release Inventory, http://www.epa.gov Texas Environmental Profiles, http://www.texasep.org
ALA. (2000) Lung Disease Data 2000, American Lung Association, New York. Altman, P, (1997),The Power Polluters of Texas, Clean Power Journal, Summer 1997, The Center for Energy Efficiency and Renewable Technologies (CEERT): California Beeson, W.L., Abbey, D.E. and Knutsen, S.F., (1998), Long-term Concentrations of Ambient Air Pollutants and Incident Lung Cancer in California Adults: Results from the AHSMOG Study, Environmental Health Perspectives Volume 106, Number 12, December 1998 Boffetta P., Ye W., Boman G., Nyrén O., (2002) Lung cancer risk in a population-based cohort of patients hospitalized for asthma in Sweden, European Respiratory Journal,1 January 2002, vol. 19, no. 1, pp. 127-133(7) Brown, CC. And Kessler, LG, (1988), Projections of Lung Cancer Mortality in the United States, 1985 - 2025, Journal of the National Cancer Institute, Vol. 80, No. 1, March 2, 1988 Business and Industry Data Center: http://www.bidc.state.tx.us/maps/maps/ percentelderlybelowpovertylevel.htm. CDC, 2000, History of the 1964 Surgeon General's Report on Smoking and Health, (www.cdc.gov/tobacco/30yrsgen.htm) CDC, 2002, The Burden of Chronic Diseases and their Risk Factors, National and State Perspectives, 2002. http://www.cdc.gov. EPA, 1997, Epa's Revised Ozone StandardFact SheetJuly 17, 1997, EPA, Washington DC. EPA 1997, Regulatory Impact Analysis of the New National Ambient Air Quality Standards, July 19, 1997, EPA, Washington DC EPA, 2002, Health Assessment Document For Diesel Engine Exhaust, May 2002, EPA, Washington DC. EPA 2003, Mobile Source Emissions – Past, Present and Future, Milestones. Available at: http://www.epa.gov/otaq/invntory/overview/solutions/milestones.htm
Hanson, M.J. (1999). Which straw will break the camel’s back? American Journal of Nursing, 99(11), 64-68. Hood, E (2002), Particulate Matter – a Particular Concern, Environmental Health Perspectives, Vol. 110, No. 8, August 2002 Lawrence Berkeley National Laboratory website: http://www.lbl.gov/Education/ELSI/pollution-main.html Mintz, J., (1999) Texas Environment Could Work Against Bush, Washington Post, Friday, October 15, 1999; Page A1. Monahan, P., (2002), Pollution Report Card: Grading America's School Bus Fleets, Union of Concerned Scientists: Cambridge, Mass. Office of the Governor website: http://www.governor.state.tx.us/priorities. PHS, 1964, Smoking and Health: Report of the Advisory Committee to the Surgeon General of the Public Health Service, 1964, PHS Publication 1113. Washington D.C. Sierra Club Factsheet: Dirty Diesel, Sierra Club website: http://www.sierraclub.org/cleanair/factsheets/diesel.asp Soares, C., (2002), Take a Deep Breath of Platinum Dust, Discover, Vol. 23, No. 1 January 2002 Texas Cancer Data Center (1998), http://www.texascancercouncil.org/impact/pg62_2.html Texas Dept of Transport. http://www.dot.state.tx.us Texas Environmental Profiles website: http://www.texasep.org WHO, 2000. World Health Organisation Press Release WHO/29, May 2 2000. Available at: http://www.who.int/inf-pr-2000/en/pr2000-29.html