Chapter 4 Measures of Variability
650 likes | 1.41k Views
Chapter 4 Measures of Variability. PowerPoint Lecture Slides Essentials of Statistics for the Behavioral Sciences Eighth Edition by Frederick J Gravetter and Larry B. Wallnau. Learning Outcomes. Tools You Will Need. Summation notation (Chapter 1) Central tendency (Chapter 3) Mean Median.

Chapter 4 Measures of Variability
E N D
Presentation Transcript
Chapter 4Measures of Variability PowerPoint Lecture SlidesEssentials of Statistics for the Behavioral SciencesEighth Edition by Frederick J Gravetter and Larry B. Wallnau
Tools You Will Need • Summation notation (Chapter 1) • Central tendency (Chapter 3) • Mean • Median
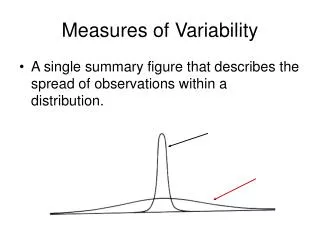
4.1 Overview • Variability can be defined several ways • A quantitative distance measure based on the differences between scores • Describes distance of the spread of scores or distance of a score from the mean • Purposes of Measure of Variability • Describe the distribution • Measure how well an individual score represents the distribution
Three Measures of Variability • The Range • The Variance • The Standard Deviation
4.2 The Range • The distance covered by the scores in a distribution • From smallest value to highest value • For continuous data, real limits are used • Based on two scores, not all the data • An imprecise, unreliable measure of variability range = URL for Xmax — LRL for Xmin
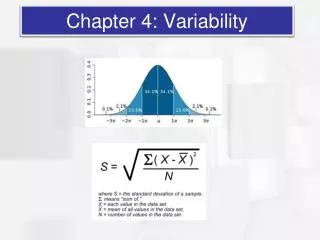
4.3 Standard Deviation and Variance for a Population • Most common and most important measureof variability is the standard deviation • A measure of the standard, or average, distance from the mean • Describes whether the scores are clustered closely around the mean or are widely scattered • Calculation differs for population and samples • Variance is a necessary companion concept to standard deviation but not the same concept
Defining the Standard Deviation • Step One: Determine the Deviation • Deviation is distance from the mean • Step Two: Find a “sum of deviations” to use as a basis of finding an “average deviation” • Two problems • Deviations sum to 0 (because M is balance point) • If sum always 0, “Mean Deviation” will always be 0. • Need a new strategy! Deviation score = X — μ
Defining the Standard Deviation(continued) • Step Two Revised: Remove negative deviations • First square each deviation score • Then sum the Squared Deviations (SS) • Step Three: Average the squared deviations • Mean Squared Deviation is known as “Variance” • Variability is now measured in squared units Population variance equals mean (average) squared deviation (distance) of the scores from the population mean
Defining the Standard Deviation(continued) • Step Four: • Goal: to compute a measure of the “standard” (average) distance of the scores from the mean • Variance measures the average squared distance from the mean—not quite our goal • Adjust for having squared all the differences by taking the square root of the variance • Standard Deviation =
Population Variance Formula sum of squared deviationsVariance = number of scores • SS (sum of squares) is the sum of the squared deviations of scores from the mean • Two formulas for computing SS
Two formulas for SS Definitional Formula Computational Formula • Square each score and sum the squared scores • Find the sum of scores, square it, divide by N • Subtract the second part from the first • Find each deviation score (X–μ) • Square each deviation score, (X–μ)2 • Sum up the squared deviations
Caution Required! When using the computational formula, remember…
Population Variance:Formula and Notation Formula Notation Variance is the average of squared deviations, so we identify population variance with a lowercase Greek letter sigma squared: σ2 Standard deviation is the square root of the variance, so we identify it with a lowercase Greek letter sigma: σ
Learning Check • Decide if each of the following statements is True or False.
Learning Check • The standard deviation measures …
Learning Check - Answer • The standard deviation measures …
4.4 Standard Deviation and Variance for a Sample • Goal of inferential statistics: • Draw general conclusions about population • Based on limited information from a sample • Samples differ from the population • Samples have less variability • Computing the Variance and Standard Deviation in the same way as for a population would give a biased estimate of the population values
Sample Variance andStandard Deviation • Sum of Squares (SS) is computed as before • Formula for Variance has n-1 rather than N in the denominator • Notation uses s instead of σ
Degrees of Freedom • Population variance • Mean is known • Deviations are computed from a known mean • Sample variance as estimate of population • Population mean is unknown • Using sample mean restricts variability • Degrees of freedom • Number of scores in sample that are independent and free to vary • Degrees of freedom (df) = n – 1
Learning Check • A sample of four scores has SS = 24.What is the variance?
Learning Check - Answer • A sample of four scores has SS = 24.What is the variance?
Learning Check • Decide if each of the following statements is True or False.
4.5 More About Variance and Standard Deviation • Mean and standard deviation are particularly useful in clarifying graphs of distributions • Biased and unbiased statistics • Means and standard deviations together provide extremely useful descriptive statistics for characterizing distributions
Showing Mean andStandard Deviation in a Graph • For both populations and samples it is easy to represent mean and standard deviation • Vertical line in the “center” denotes location of mean • Horizontal line to right, left (or both) denotes the distance of one standard deviation
Sample Variance as anUnbiased Statistic • Unbiased estimate of a population parameter • Average value of statistic is equal to parameter • Average value uses all possible samples of a particular size n • Corrected standard deviation formula (dividing by n-1) produces an unbiased estimate of the population variance • Biased estimate of a population parameter • Systematically overestimates or underestimates the population parameter
Standard Deviation and Descriptive Statistics • A standard deviation describes scores in terms of distance from the mean • Describe an entire distribution with just two numbers (M and s) • Reference to both allows reconstruction of the measurement scale from just these two numbers (Figure 4.7)
Transformations of Scale • Adding a constant to each score • The Mean is changed • The standard deviation is unchanged • Multiplying each score by a constant • The Mean is changed • Standard Deviation is also changed • The Standard Deviation is multiplied by that constant
Variance and Inferential Statistics • Goal of inferential statistics is to detect meaningful and significant patterns in research results • Variability in the data influences how easy it is to see patterns • High variability obscures patterns that would be visible in low variability samples • Variability is sometimes called error variance
Learning Check • A population has μ = 6 and σ = 2. Each score is multiplied by 10. What is the shape of the resulting distribution?
Learning Check - Answer • A population has μ = 6 and σ = 2. Each score is multiplied by 10. What is the shape of the resulting distribution?
Learning Check TF • Decide if each of the following statements is True or False.