Download
1 / 40
400 likes | 619 Views
Unit 1 Microeconomics of the Firm. Horizontal Boundaries from Scale and Scope Economies. AEC 422 Lecture 2/3 Sept 5,10. Read Ch 2 Basenko Exercise # 1 Due Sept 10. Horizontal Boundaries of the Firm Chapter 2 Overview 1.

E N D
Unit 1 Microeconomics of the Firm Horizontal Boundariesfrom Scale and Scope Economies AEC 422 Lecture 2/3 Sept 5,10
Read Ch 2 Basenko • Exercise # 1 Due Sept 10
Horizontal Boundaries of the FirmChapter 2 Overview1 • Chapter is intended to help you understand how to more fully answer the following strategy questions: • How do we define “our” firm? • What activities is the firm engaged in? • What are our firm’s “boundaries” – what products or services? • Is bigger better? Nest Fresh Eggs - epilogue
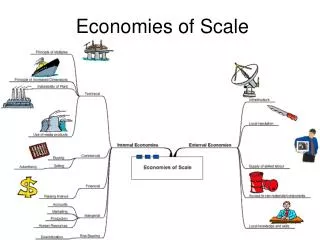
Horizontal Boundaries • Refers to the quantities (scale) and varieties (scope) of goods and services a firm produces and sells • Food companies are extensively diversified horizontally. Diamond Foods, Inc. • Look at an agribusiness company like ADM • Processing and services across wide range of product types
Horizontal Boundaries • Firms having extensive horizontal boundaries are said to exhibit economies of scale (or size) and scope -Declining average costs with volume (scale) -How does variety of related products offered (scope) lower costs?
Horizontal Boundaries • Economies of scale and scope are present whenever larger: • Production • Distribution • Marketing • And/or retailing processes result in a cost advantage over smaller processes
Horizontal Boundaries • In some industries a few large firms dominate the market • Farm implements (John Deere) • Corn sweetener manufacturing (ADM) • Ready-to-eat breakfast cereals (Kellogg/General Mills) • Pet Food (Purina) • Eggs – Cal Maine, Land O Lakes? • In others, smaller firms are the norm • Higher education (private colleges) • Apparel design, art studios • Farms, wineries, landscaping services, artisanal products
(Source: Milling and Baking News 2010) Note: Kellogg 2009 adv expense: $1.091 billion
Economies of Size and ScopeWhy Important? • Affects size of firms and structure of markets • Fundamental to merger/acquisition strategies • Affects pricing and entry strategies • Fundamental to formulating competitive strategy and sustaining that strategy
Determinants of Horizontal Boundaries • Economies of scale • Declining average cost with volume • Economies of scope • Cost savings when different goods/services are produced “under one roof” • Learning curve • Cost advantage from accumulated expertise and knowledge
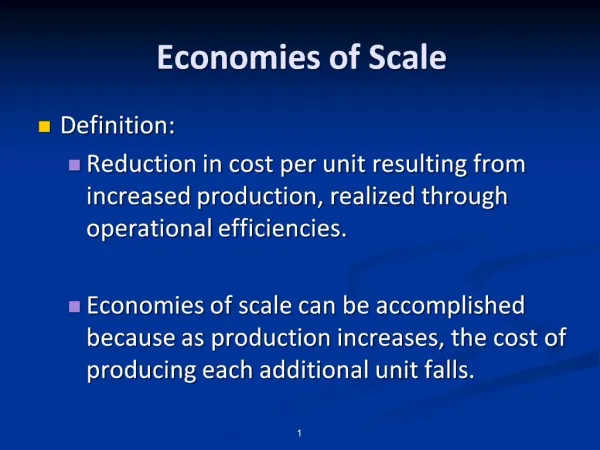
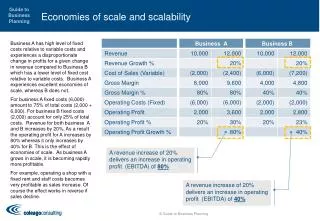
Economies of Scale • Said to exist when Average Cost (AC) declines as Quantity (Q) increases • What is Average Cost? Cost per unit – declining initially as fixed costs are spread out over additional units of output, increasing as production meets capacity constraints
Average Cost (AC) • AC = Total Cost (TC) / Output (Q) • What is TC? • Made up of Total Variable Costs (TVC) and Total Fixed Costs (TFC)
Costs of Production • Since TC = TVC + TFC • Then AC = (TVC + TFC) / Q • So AC = (TVC / Q) + (TFC / Q) • Or AC = AVC + AFC
Why Do We Observe Economies of Scale? • Answer lies in our last definition of AC • AC = AVC + AFC
FixedCosts • Result from owning a fixed input or resource. • Incurred even if the resource isn’t used. • Don’t change as the level of production changes (in the short run). • Exist only in the short run. • Not under the control of the manager in the short run. • The only way to avoid fixed costs is to sell the item.
Why Do We Have Fixed Costs? • Some inputs are “lumpy” or indivisible • Kellogg cereal plant. Same physical plant is necessary to make 1 box of corn flakes as is required to make 1 million boxes. • Infrastructure resources • Think in terms of fixed in the “short run” • Second, fixed costs rise when an operation is capital intensive!
Look at AFC • Text refers to this as “spreading out fixed costs” • Numerator (TFC) is fixed or constant so as the denominator (Q) increases, AFC goes lower and lower • Hence AC is also drawn somewhat lower
Important Fixed Costs • Total fixed cost (TFC): • All costs associated with the fixed input. • Average fixed cost per unit of output: AFC = TFC/Output
Variable Costs • Can be increased or decreased by the manager. • Variable costs will increase as production increases. • Total Variable cost (TVC) is the summation of the individual variable costs. • TVC = (the quantity of the input) X (the input’s price).
Important Variable Costs • Total variable cost (TVC): • All costs associated with the variable input. • Average variable cost per unit of output: AVC = TVC/Output
Average Total Cost • Average total cost per unit of output: AFC + AVC ATC = TC/Output
U-shaped cost curve $/unit
U-Shaped Cost Curve • Average cost declines as fixed costs are spread over larger volumes • Average cost eventually starts increasing as capacity constraints kick in (fixed facilities, management extensions) • U-shape implies cost disadvantage for very small and very large firms • Unique optimum size for a firm
L-shaped Cost Curve • In reality, cost curves are closer to L-shaped curves that to U-shaped curves • A minimum efficient size (MES) beyond which average costs are identical across firms
Economies of Scale Occur as Firms Become More Efficient in an Engineering/Physical Production Sense • How Does This Happen? • Nest Fresh Egg vs Cal Maine and LOL • Competitiveness from Productivity Advantages • When you produce same output with less input • When you produce more output with same input • When you produce more output with less input • What about WalMart?
Economies of Scale in Advertising and Marketing • Occur when you can spread out advertising costs over larger markets. • Reputation effects often work in your favor!
Economies of Scale in Advertising • Consider ConAgra’s flagship brand "Healthy Choice" • Can be used for ice cream products, frozen dinners and spaghetti sauce. Referred to in the literature as “umbrella branding.”
Scale Economies in Wine Advertising Source: Adams Wine Handbook, 1998
Economies of Scale in R & D • Scale economies may occur when technology in one project “spills over” into another for a company. • Example: Big life science companies develop a vaccine for humans and are able to apply it to the animal area as a vaccine.
Innovation and Size • Are big firms better at innovating compared to small firms? • Size reduces the average cost of innovations • Smallness may be more suitable for motivated researchers • Biotechnology in agribusiness - ERS debate
Economies of Scale in Distribution • Cost advantages from moving large volume of product to market – truck, rail, ship, pipeline • Distribution Centers, warehouses
Is there a shipping cost advantage for local farmers? • Watsonville, CA to Cincinnati, OH • 2,455 miles @$6,000 for 40,000 pints (lbs) • Back haul provided • Springfield, KY to Cincy • 157 miles, no back haul (so x2) • Refrigerated truck (VERY cheap at $0.85/mile) • 6 hours driving labor @$15/hour • 2,160 pints (lbs)
Economies of Scale in Procurement • May occur when there are discounts for bulk or large purchases. • Reduced transaction costs • More aggressive bargaining by large buyers • Assured flow of business for supplier
Scale and size economies:Rationale for Volume Discounts • Cost of service (per unit) is lower for large buyers • Large buyers may be more price sensitive • Large buyers can disrupt operations of the seller by refusing to buy
Diseconomies and AC • Why does this happen? 1. When input prices rise (such as wages) your cost structure rises. • This makes economies of scale shrink and diseconomies of scale grow. • Larger firms for example, tend to pay higher wages than smaller ones.
Firm Size and Labor Cost • Large firms experience lower worker turnover compared to small firms • Savings in recruitment and training costs due to lower turnover may partially offset the higher labor cost
Diseconomies and AC • Why does this happen? 2. When there are “incentive and bureaucracy effects” (also called agency effects)…..we now incur a “management” cost
Diseconomies and AC • Example of an agency effect • Most companies are absentee owned (shareholders). Professional managers hired. • Sometimes a company get lazy and flabby (or management compensation goes up too high for the value gained). • Can show up as relatively large and/or growing expense margins we can calculate from financial statements. • Compare to a small family business
Diseconomies and AC • Why does this happen? • 3. Occur when specialized resources are spread too thin. Example: as a restaurant expands the chef may find him/her self spread too thin. • Uniquely skilled inventor, artist, scientist • Consulting as an expert