Download
1 / 1
10 likes | 126 Views
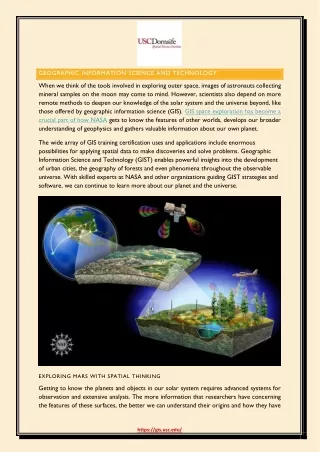
This article explores the clustering process in remote sensing, which involves grouping data objects into clusters based on similarity. High intra-cluster similarity and low inter-cluster similarity are desirable traits. Applications discussed include distinguishing ecological regions, soil and water quality assessment, and identifying agricultural patterns. Clustering algorithms, such as K-Means, are utilized within R to analyze populations in geographic databases like Landsat and LIDAR. The significance of remote sensing's reflectance properties across different wavelengths is also highlighted, offering insights for effective environmental management.

E N D
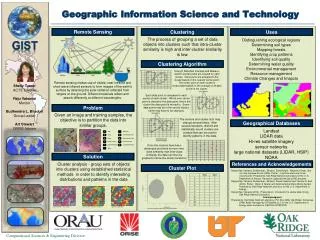
Geographic Information Science and Technology Remote Sensing Clustering Uses The process of grouping a set of data objects into clusters such that intra-cluster similarity is high and inter-cluster similarity is low. Distinguishing ecological regions Determining soil types Mapping forests Identifying crop patterns Identifying soil quality Determining water quality Environmental management Resource management Climate Changes and Imapcts GIST Clustering Algorithm Using R Statistical Interface and KMeans, random center points are created for each cluster. Data points are assigned to the cluster based on the nearest center point. The center point of each cluster is recalculated based on the average of all data points in the cluster. Remote sensing makes use of visible, near infrared and short-wave infrared sensors to form images of the earth's surface by detecting the solar radiation reflected from targets on the ground. Different materials reflect and absorb differently at different wavelengths. Shelly Turner ACTS Teacher Raju Vatsavai Mentor Budhendra L. Bhaduri Group Leader Art Stewart ORISE Advisor Ecological Regions Soil Type Each data point is compared to each center of each cluster. Which ever center point is closest to the data point, that is the cluster the data point is moved to. Some data points may be in the correct cluster, some may have to be changed. • Given an image and training samples, the objective is to partition the data into similar groups. Problem The centers and cluster size may change several times. After several iterations, distinct and statistically sound clusters are created that can be used to identify patterns in the data. Geographical Databases Landsat LIDAR data Hi-res satellite imagery sensor networks large national datasets (LIDAR, HSIP) NOAA Once the clusters have been developed and there is more intra-class similarity than inter-class similarity, the data can then be graphed to show the cluster locations. Solution Cluster analysis - group sets of objects into clusters using established statistical methods in order to identify interesting distributions and patterns in the data References and Acknowledgements Cluster Plot • Ranga Raju Vatsavai, Budhendra L. Bhaduri, Eddie Bright, Nagendra Singh, Goo Jun and JoydeepGhosh (2009). Poster: Land Use and Land Cover Classification. Prepared by Oak Ridge National Laboratory for the U. S. Department of Energy. Research supported through LDRD program. • Ranga Raju Vatsavai, Budhendra L. Bhaduri, ShashiShekhar and Thomas E. Burk (2009). Poster: Miner: A Spatial and Spatiotemporal Data Mining System. Prepared by Oak Ridge National Laboratory for the U. S. Department of Energy. • Ranga Raju Vatsavai (2010). Presentation: Introduction to spatial data mining. Oak Ridge National Laboratory. • Acknowledgment • Prepared by Oak Ridge National Laboratory, P.O. Box 2008, Oak Ridge, Tennessee 37831-6285, managed by UT-Battelle, LLC for the U. S. Department of Energy under contract no. DEAC05-00OR22725. Landsat ETM – FCC Image Classification with iid assumption Spatial classification